Case study · Frontend
ResView
Byzantine consensus you can watch, one message at a time.
- Role
- Designed and built the frontend. 316 of the repo's 385 commits
- Where
- ExpoLab, UC Davis, on Apache ResilientDB (incubating)
- Frontend
- React, D3.js, Nivo, Tailwind CSS
- Year
- 2023 to 2025. Used in UC Davis courses
Summary
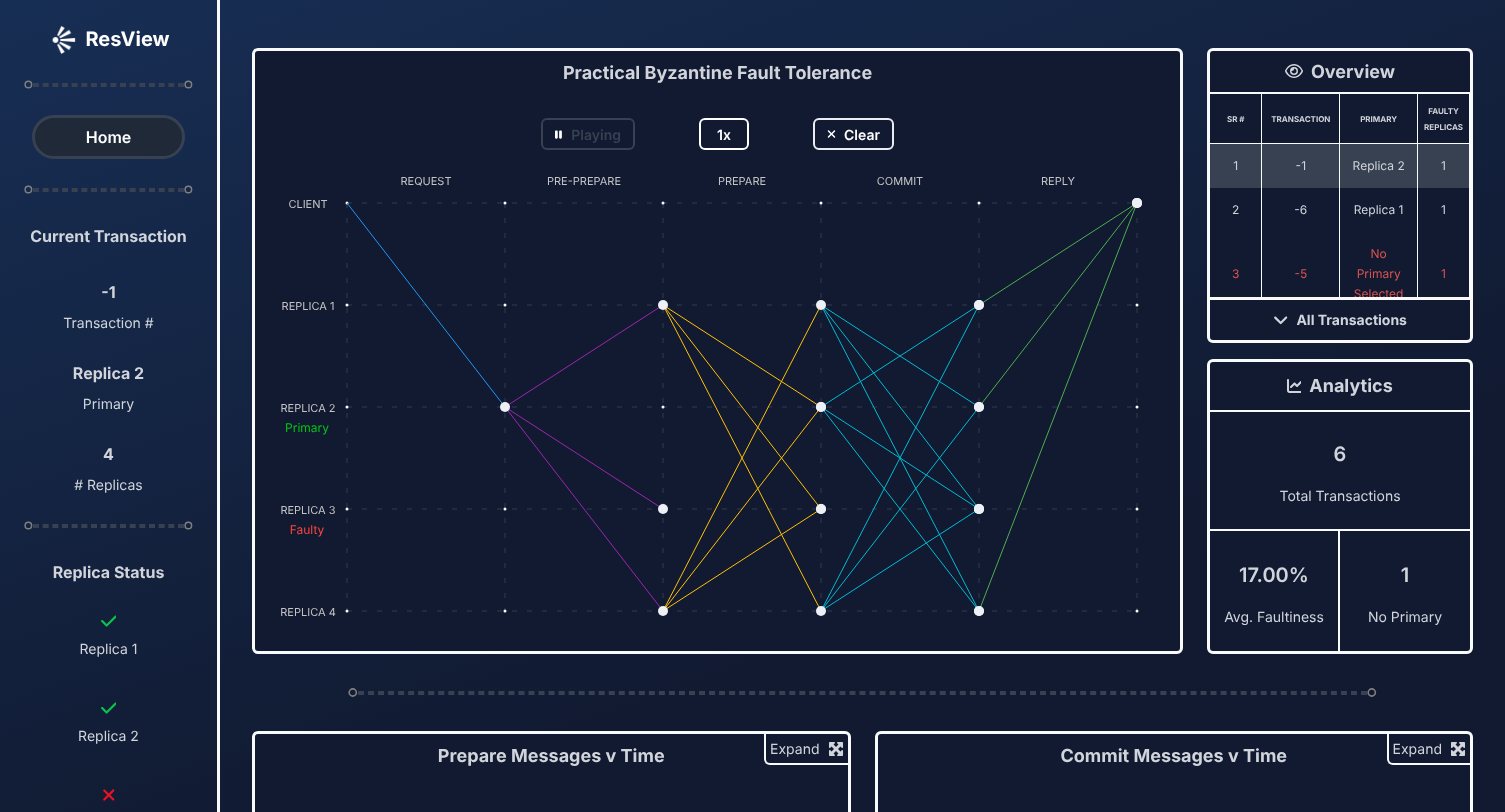
PBFT is how a blockchain's replicas agree on a transaction even when some of them lie. On paper it's a wall of arrows. ResView draws each round the way it happened in ResilientDB: every pre-prepare, prepare, commit and reply as a line you can watch travel, with faulty replicas, timings and charts alongside.
5
consensus phases, animated from request to reply
f = 1
faulty replica a 4-node cluster survives, and you pick which
316
of the repo's 385 commits are mine
300+
students in UC Davis courses
My part
What I built
The frontend is mine, from the first commit in November 2023 to the latest release. Saipranav Kotamreddy wrote the replica data feed, over WebSockets in 2023 and by polling in 2024.
- Consensus graph
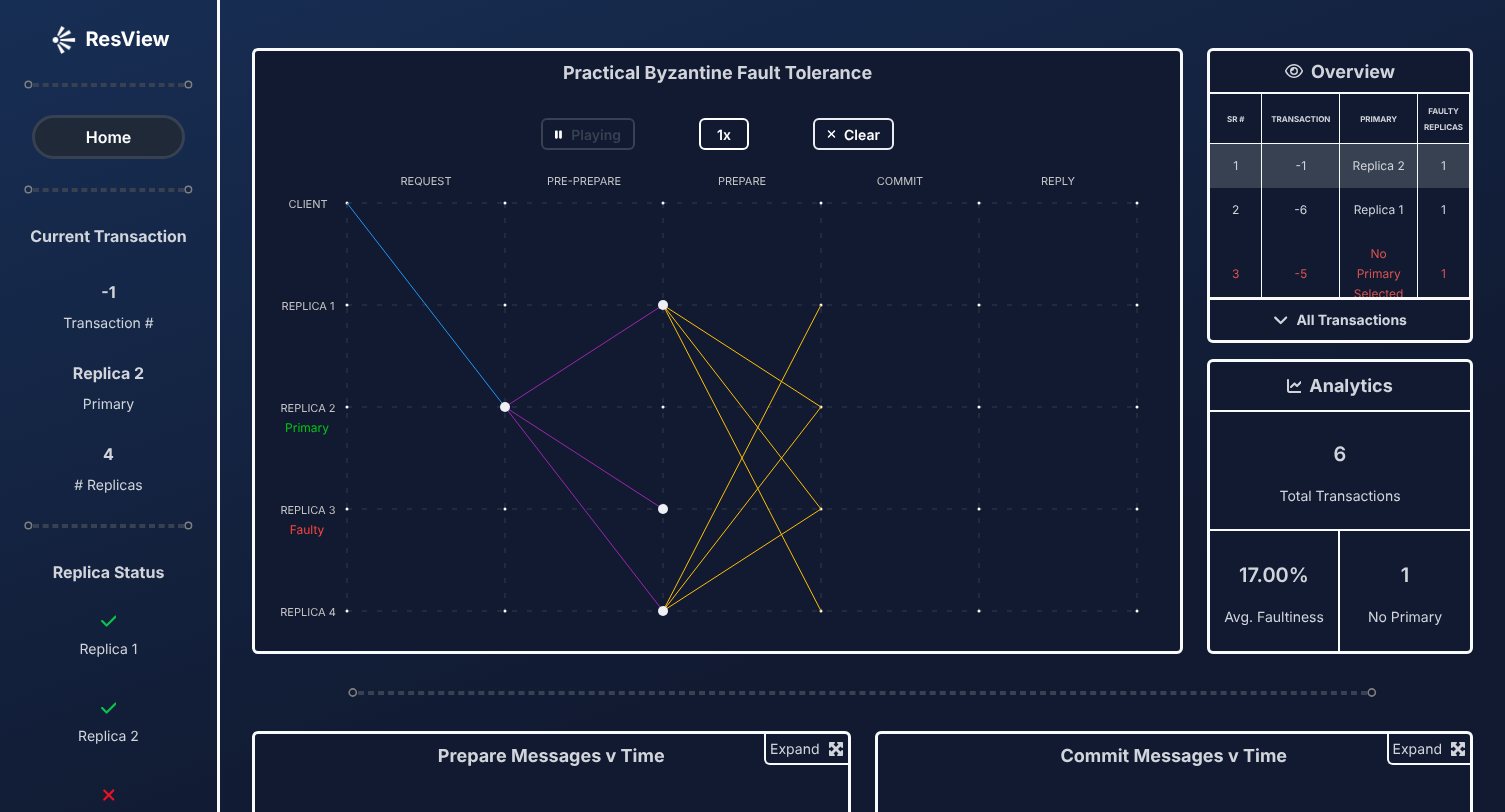
- The D3 graph: each message path fades in, then a dot travels it, phase by phase, with the primary and faulty replicas labelled.
- Playback
- Play, clear and three speeds, each with its own phase timings.
- Fault modes
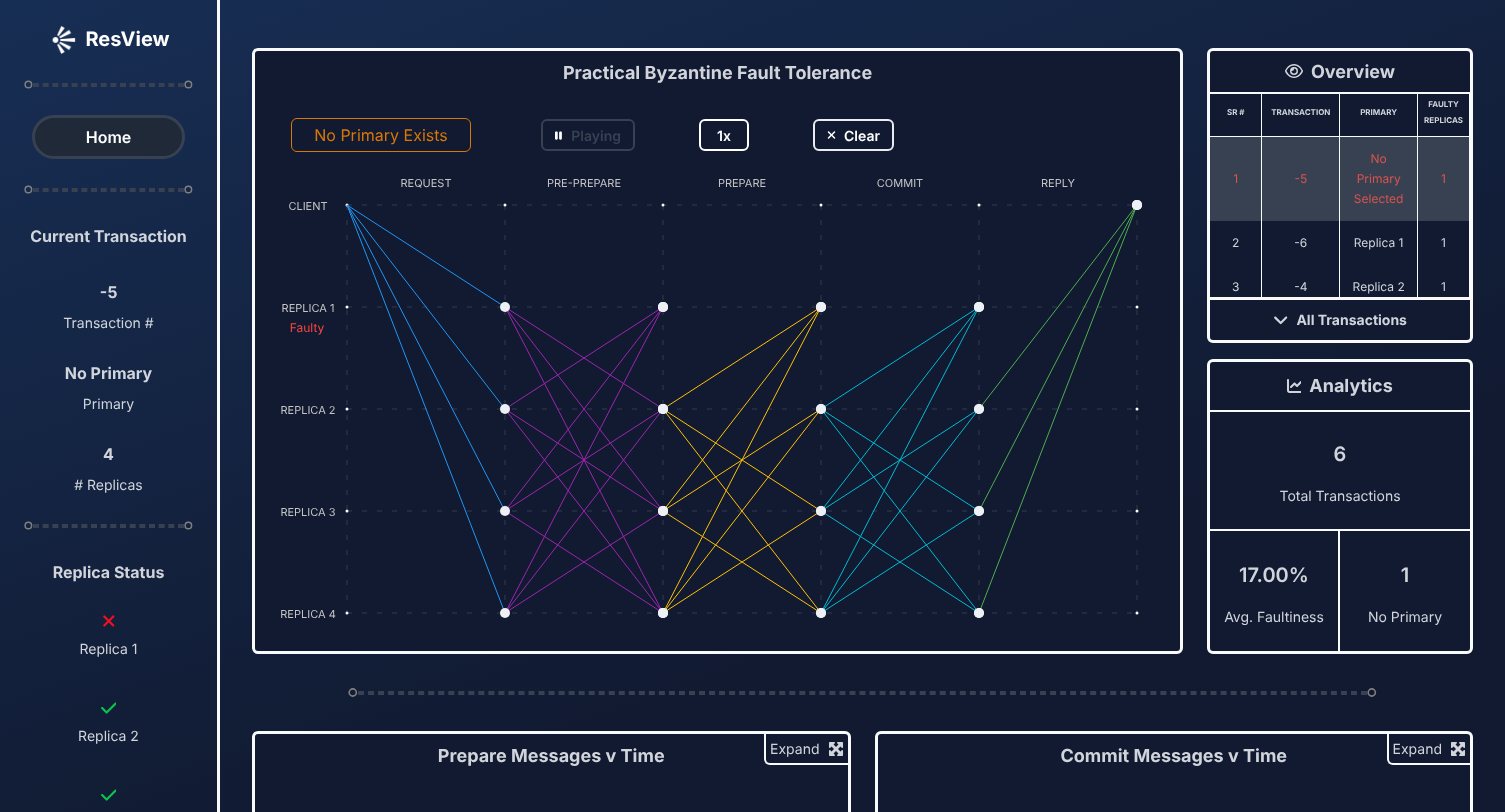
- Faulty replicas drawn sending no prepare, commit or reply, and a no-primary mode where every healthy replica broadcasts.
- Dashboard
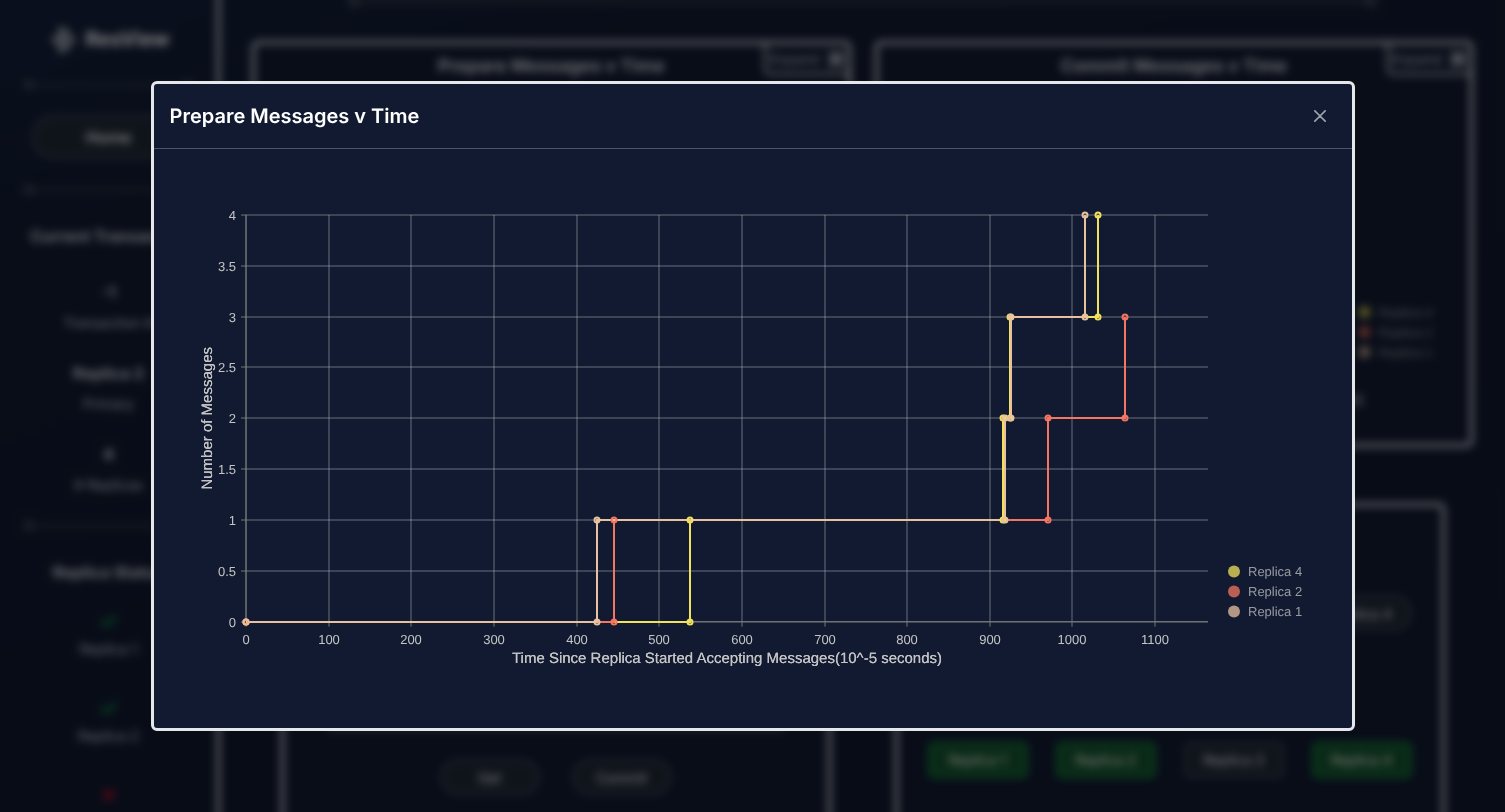
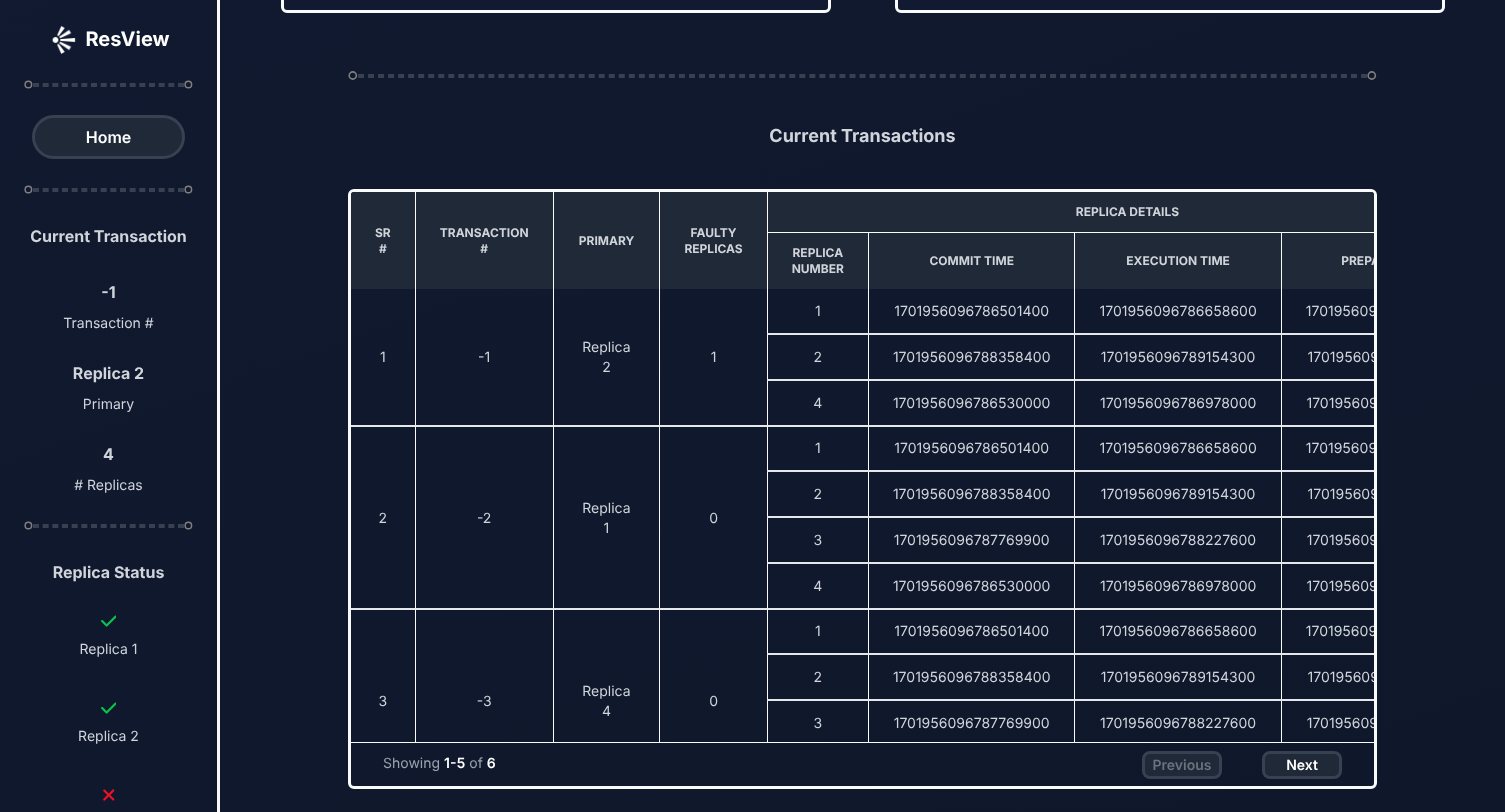
- Sidebar status, overview and analytics panels, message-timing charts that open full size, and a transaction table that replays a round on click.
- Landing page
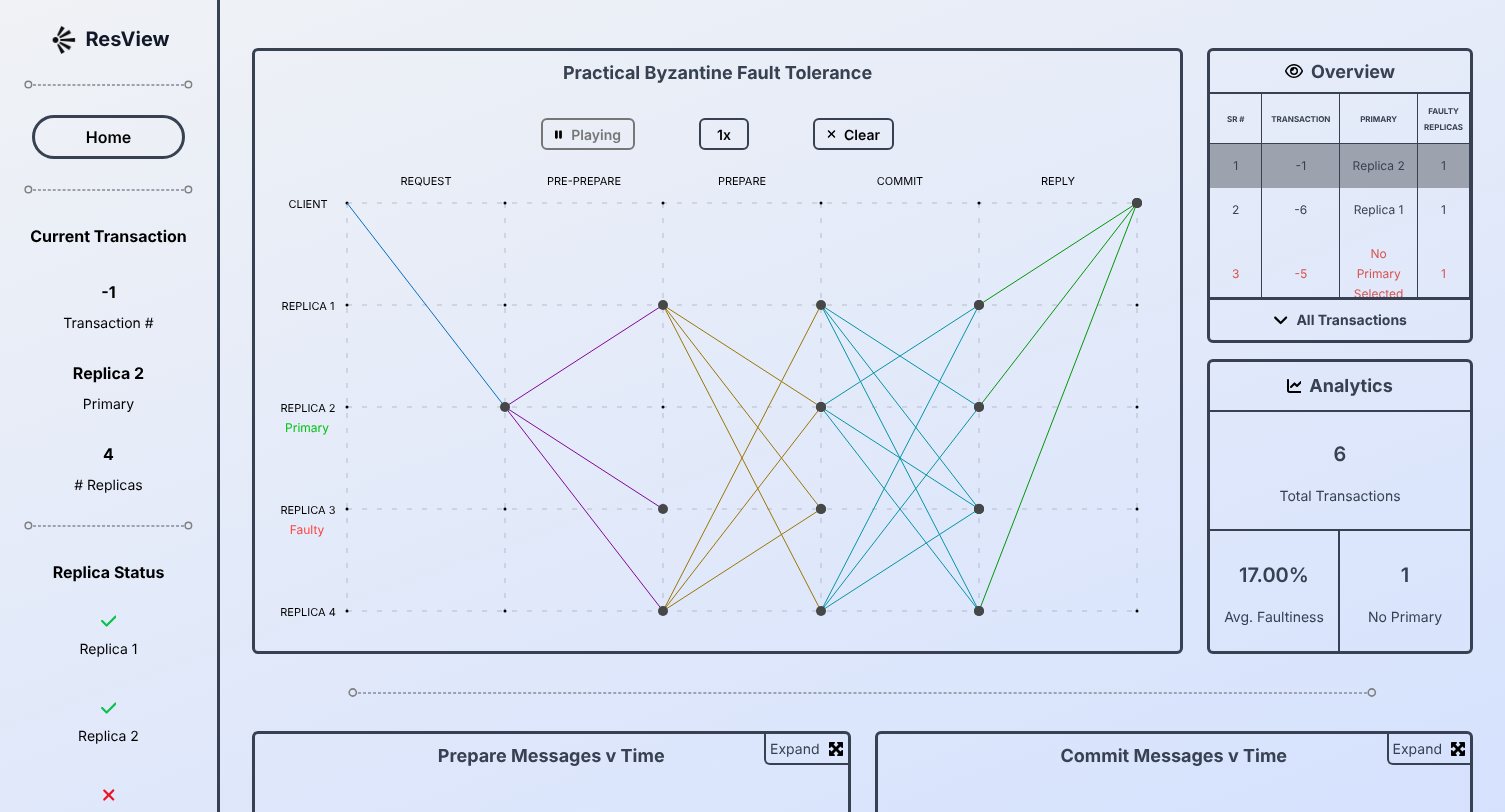
- A PBFT explainer, light and dark themes, and the team page.
- Delivery
- Ticketed branches and 64 merged pull requests across the 2024 and 2025 releases.
01 · Visualizer
Every message in a round, drawn as it travels
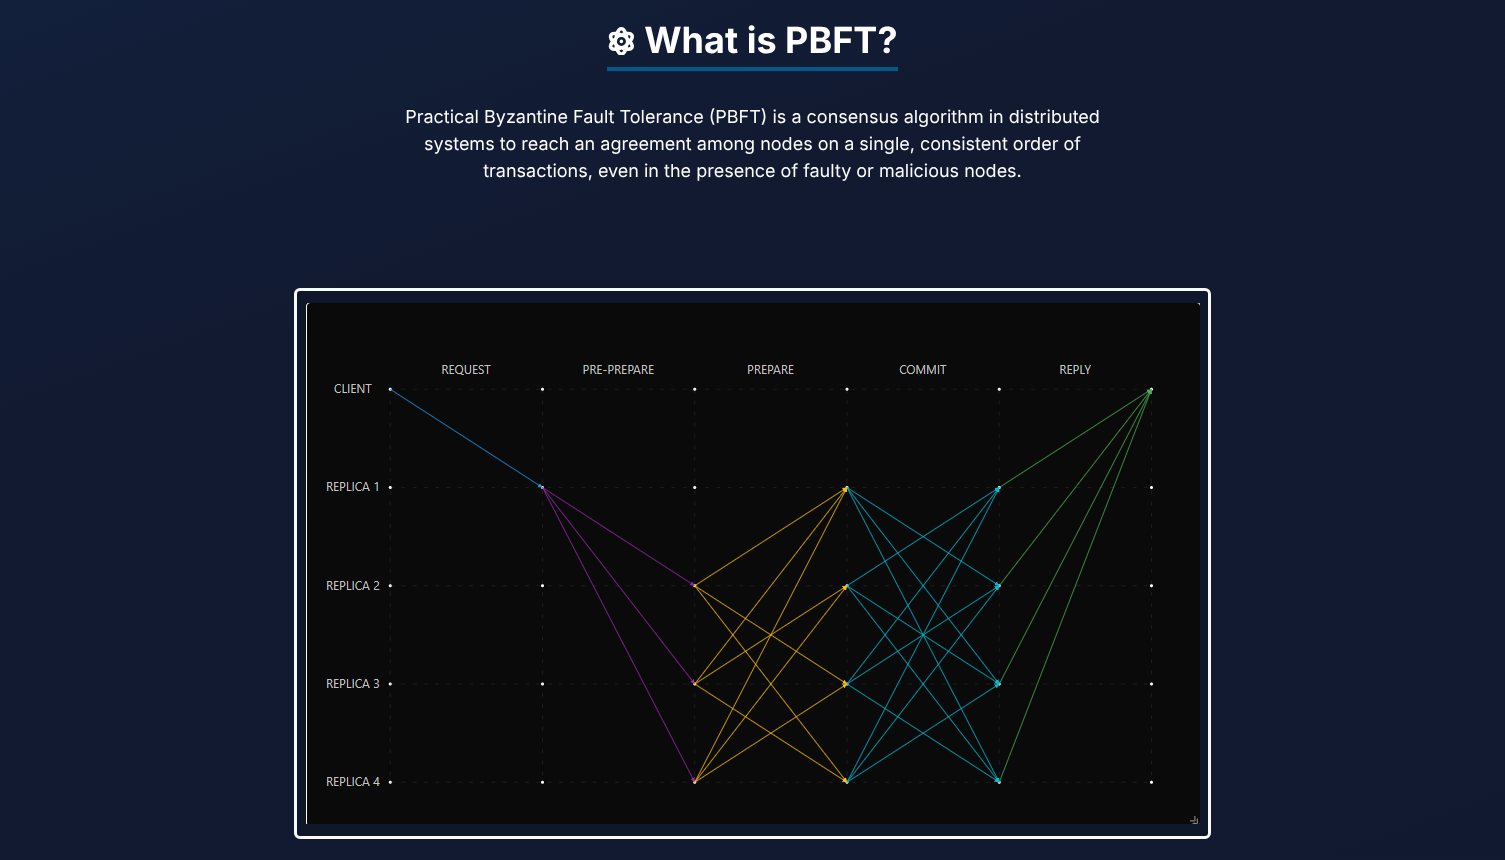
Rows are the client and the replicas, columns are the phases. Each message fades in as a line and a dot runs along it, so you see who talked to whom and in what order.
02 · Dashboard
Numbers next to the picture
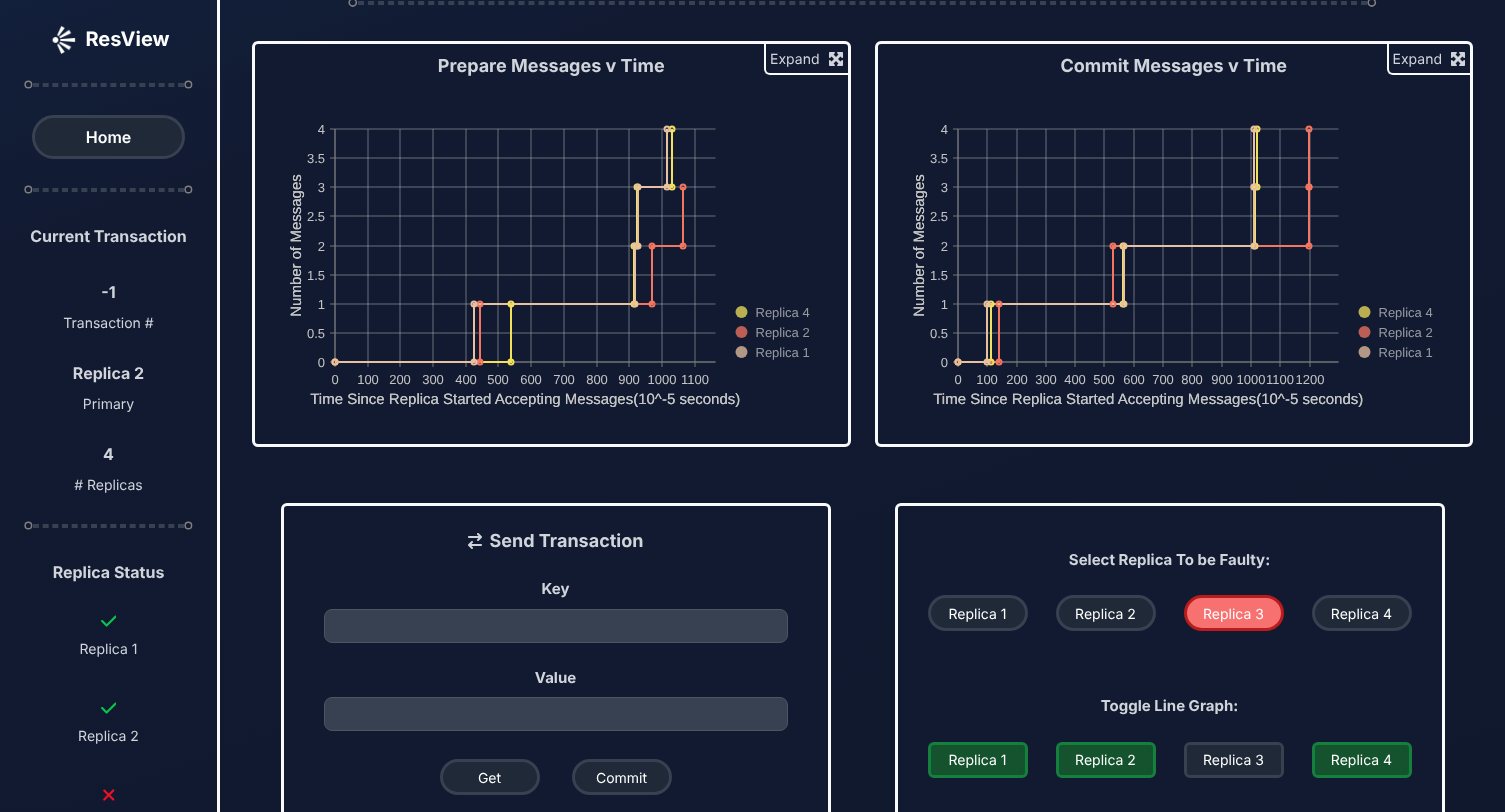
Below the graph: when each replica's prepare and commit messages arrived, a form to send a transaction, the switch that makes a replica faulty, and every transaction in a table.
03 · Landing page
Teach PBFT, then show it
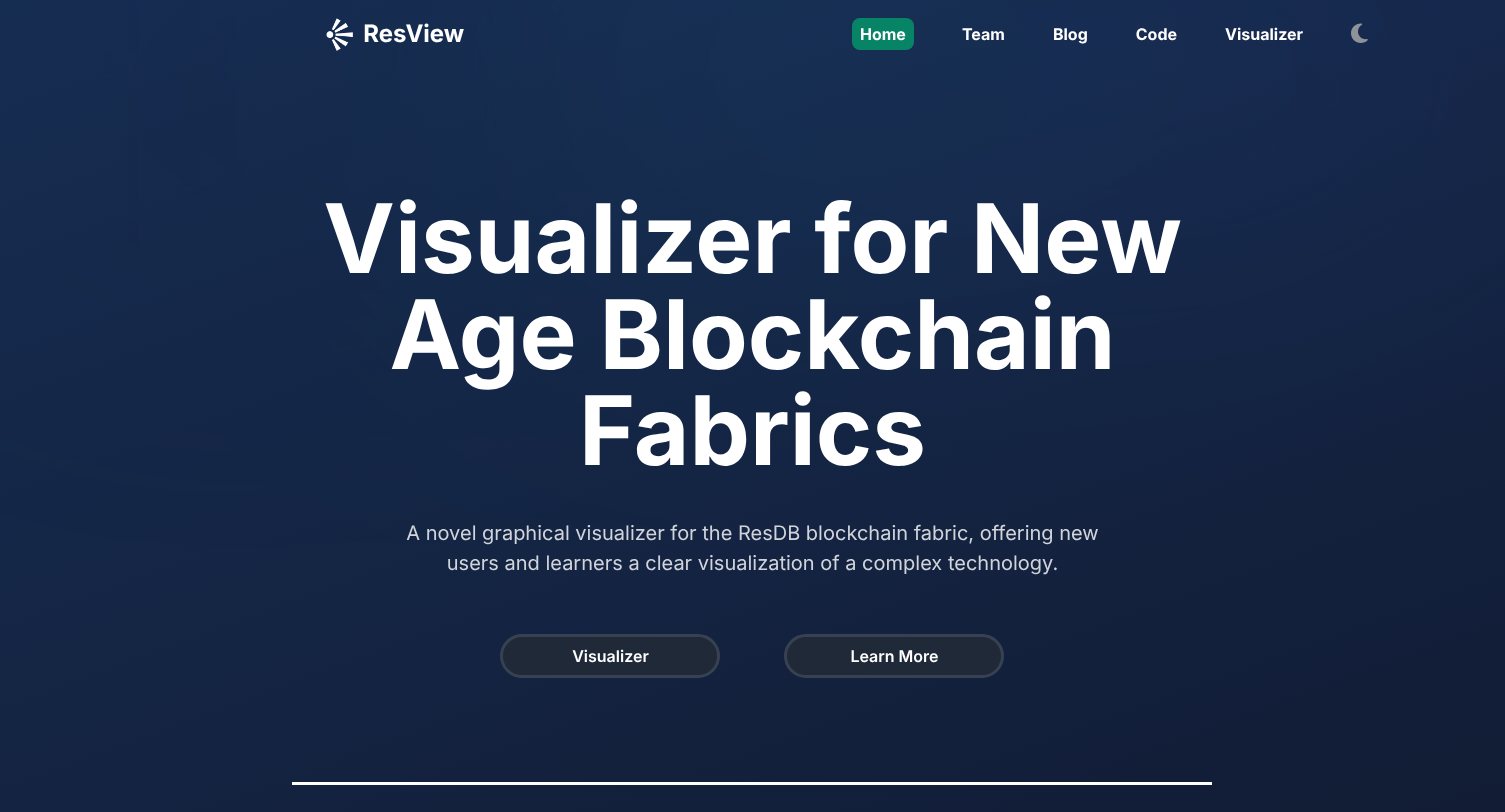
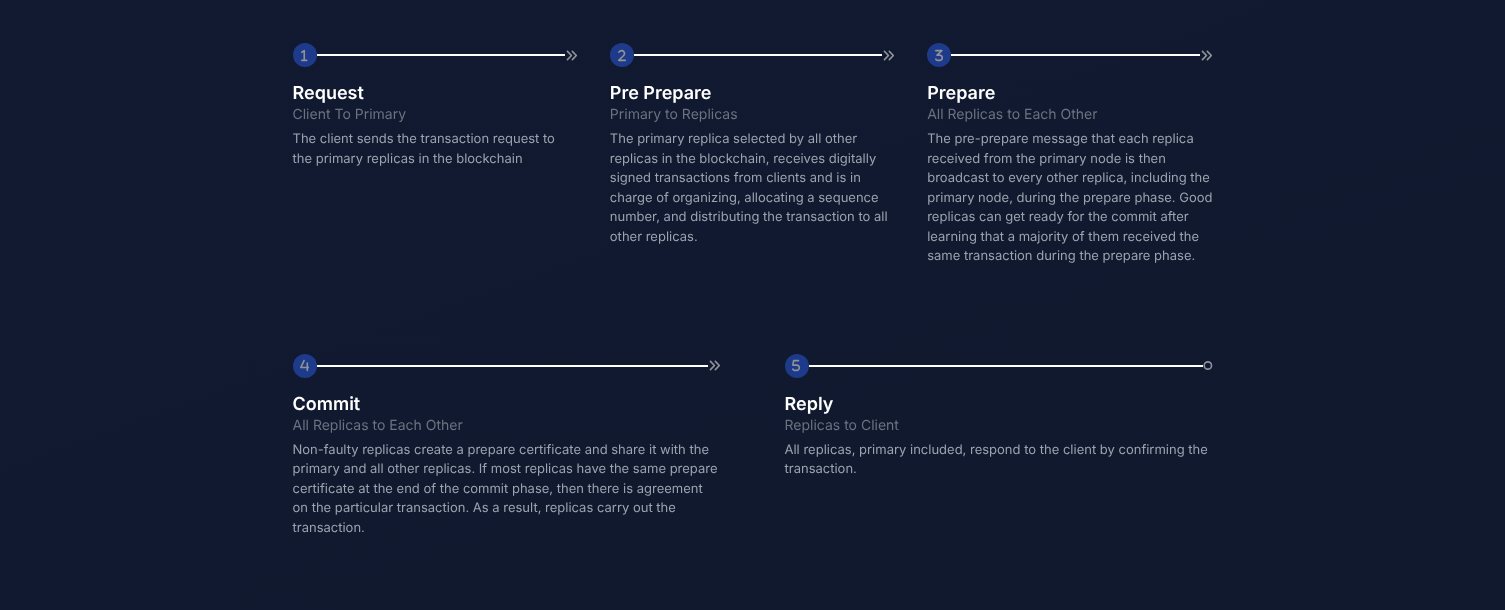
The home page explains the five phases with a screenshot of the tool's graph, so a student arrives at the visualizer knowing what to watch for.
04 · Mobile
Desktop only, on purpose
Five phases across and five rows down need the full width to stay readable, so phones get a short note pointing to a laptop instead of a squeezed graph. A phone layout is first on the list below.
05 · Design system
Night navy, teal, and one color per phase
- Ground#0F172A
- Teal#26D8C4
- Request#2196F3
- Pre-prepare#9C27B0
- Prepare#FFC107
- Commit#00BCD4
- Reply#4CAF50
System UI
Replica 3 · Faulty
Labels, numbers and headings. No web font to load in a tool that's mostly lines.
- Each phase keeps its color in the graph and the explainer; the timing charts color by replica instead.
- The light theme swaps in darker versions of the five phase colors instead of reusing the dark ones.
- The theme is saved locally and set as data-theme on the page, which Tailwind's dark variant reads.
06 · Tech
From replicas to a graph
1 · Replicas
ResilientDB with ResView on
Four replicas run with enable_resview, which exposes each transaction's phase timestamps, primary and messages received.
2 · Fetch
Four endpoints, in parallel
The app reads /consensus_data from every replica every 20 seconds and merges the results by transaction. The first version streamed over WebSockets.
3 · Compute
Points, lines, connections
Plain functions turn a transaction into grid points and the lines between them, allowing for faulty replicas and a missing primary.
4 · Draw
D3 on stacked SVGs
D3 draws on four stacked SVG layers, staggering each phase's messages, so a round plays back in order at any of three speeds.
Works without a cluster
The app starts with six sample transactions and keeps them if the replicas can't be reached, so it teaches even offline.
Math apart from drawing
Layout lives in plain functions and D3 only renders, so a replay, resize or speed change just reruns the layout and redraws.
Small contexts
Five React contexts composed into one provider, so each panel reads only what it needs, with no props passed through every layer.
- React
- D3.js
- Nivo
- Tailwind CSS
- React Router
- Axios
- Apache ResilientDB
07 · Code
A dot that follows the line
Each message is a path that fades in after its phase delay. When it finishes, a dot appears and is moved along the path's own geometry with getPointAtLength, so it follows any curve exactly.
Lines 51 to 78, unedited apart from indentation.
line.transition()
    .duration(duration / 2)
    .delay(delay)
    .style("opacity", 1)
    .on("end", function () {
        let dot = svg.append("circle")
            .attr("r", 5)
            .attr("fill", `${dotColor}`)
            .attr("cx", lineData[0][0])
            .attr("cy", lineData[0][1])
            .style("opacity", 0);

        dot.transition()
            .duration(duration / 2)
            .style("opacity", 1)
            .attrTween("cx", function () {
                return function (t) {
                    var interpolatedPoint = line.node().getPointAtLength(t * line.node().getTotalLength());
                    return interpolatedPoint.x;
                };
            })
            .attrTween("cy", function () {
                return function (t) {
                    var interpolatedPoint = line.node().getPointAtLength(t * line.node().getTotalLength());
                    return interpolatedPoint.y;
                };
            });
    })
08 · Performance
What the build ships
The original deployment has moved, so these come from the production build in the repo, measured gzipped the way a static host serves it.
Production build
Create React App · gzip- main bundle, including D3 and the charts
261KB
- JavaScript in all 69 chunks
317KB
- CSS, one file
7KB
09 · Next
What I'd ship next
- 01A phone layout with one replica per row, so the desktop-only note can go.
- 02Fix the arrowheads: markers are defined as arrow-request but referenced as arrow-&request, so they never render.
- 03Step through a round one message at a time, not just play and clear.
- 04Split D3 and the charts out of the 261 KB main bundle so the landing page loads lighter.
- 05Bring the live deployment back at a stable address.