Case study · Frontend
FRED
Spatial agents for bioenergy optimization that show their work.
- Role
- Founder. Designed and shipped the first release end to end
- Frontend
- React, TypeScript, Tailwind CSS, Leaflet
- Year
- 2026. Live at biofred.us, in beta
- Recognition
- NSF I-Corps, 2026 cohort
Summary
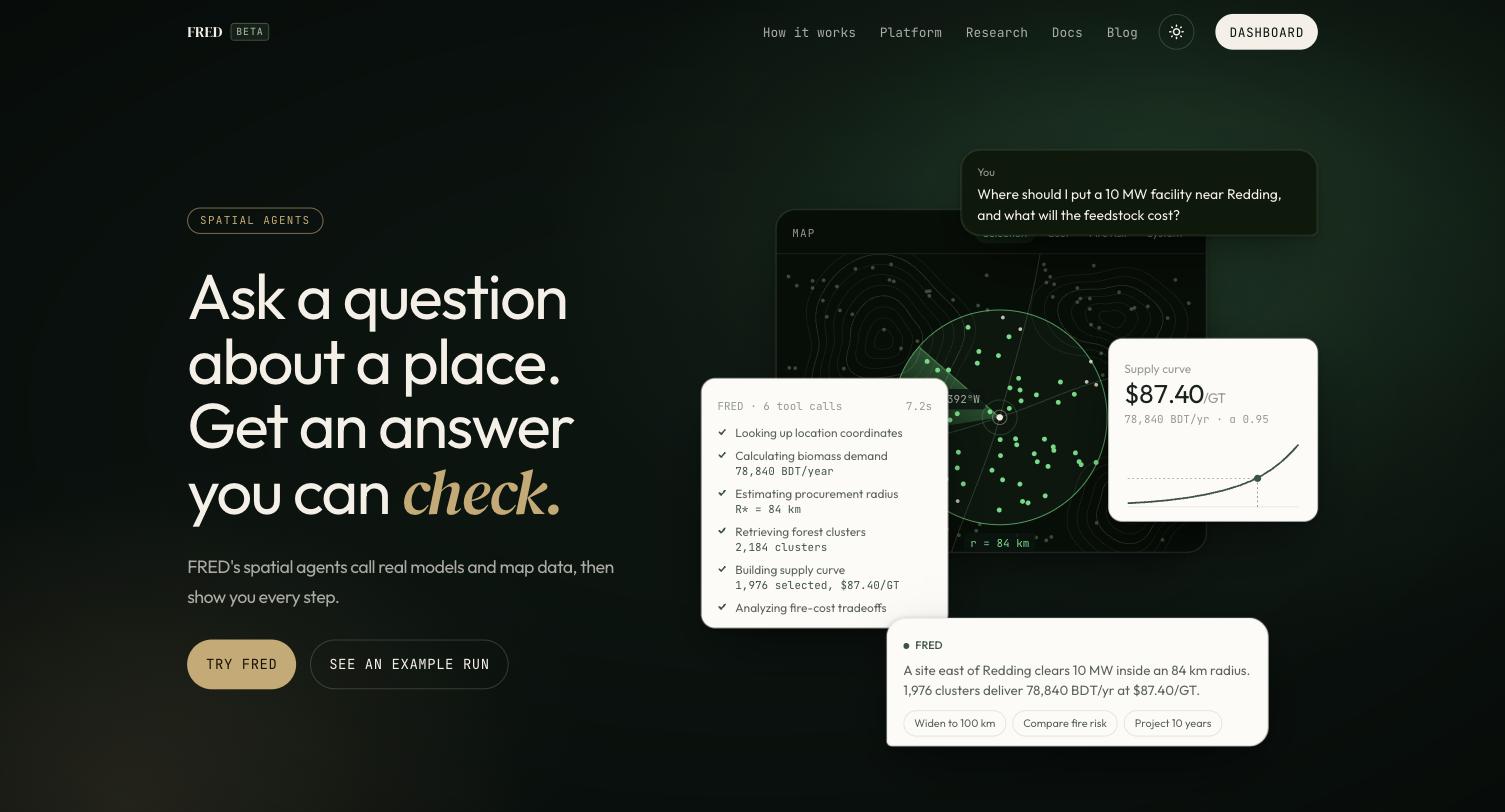
FRED turns a question about a place into a siting report with numbers you can check. The frontend's job was to make an AI agent's work visible: each tool call streams onto the screen as it runs, and every figure in the answer points back to the step that made it.
107KB
JavaScript on the landing page, compressed
0
layout shift on first load
2
themes from one set of color tokens
7.2s
example run, streamed step by step
My part
What I shipped
The first release was mine end to end, from the first sketch to the deploy pipeline. The team has grown since.
- Design
- Brand, layouts and the color-token system behind the dark and light themes.
- Landing and blog
- Scroll-driven sections that replay a real run, and the research blog on a Sanity CMS.
- App frontend
- Dashboard, Leaflet map workspace, the streaming run log and saved runs with export.
- Agent backend
- FastAPI agent loop, Redis caching and the PostGIS and H3 data layer.
- Infrastructure
- Deployment and continuous delivery on Google Cloud.
- Research
- The Compositional Spatial retrieval architecture and the write-ups behind it.
01 · Landing page
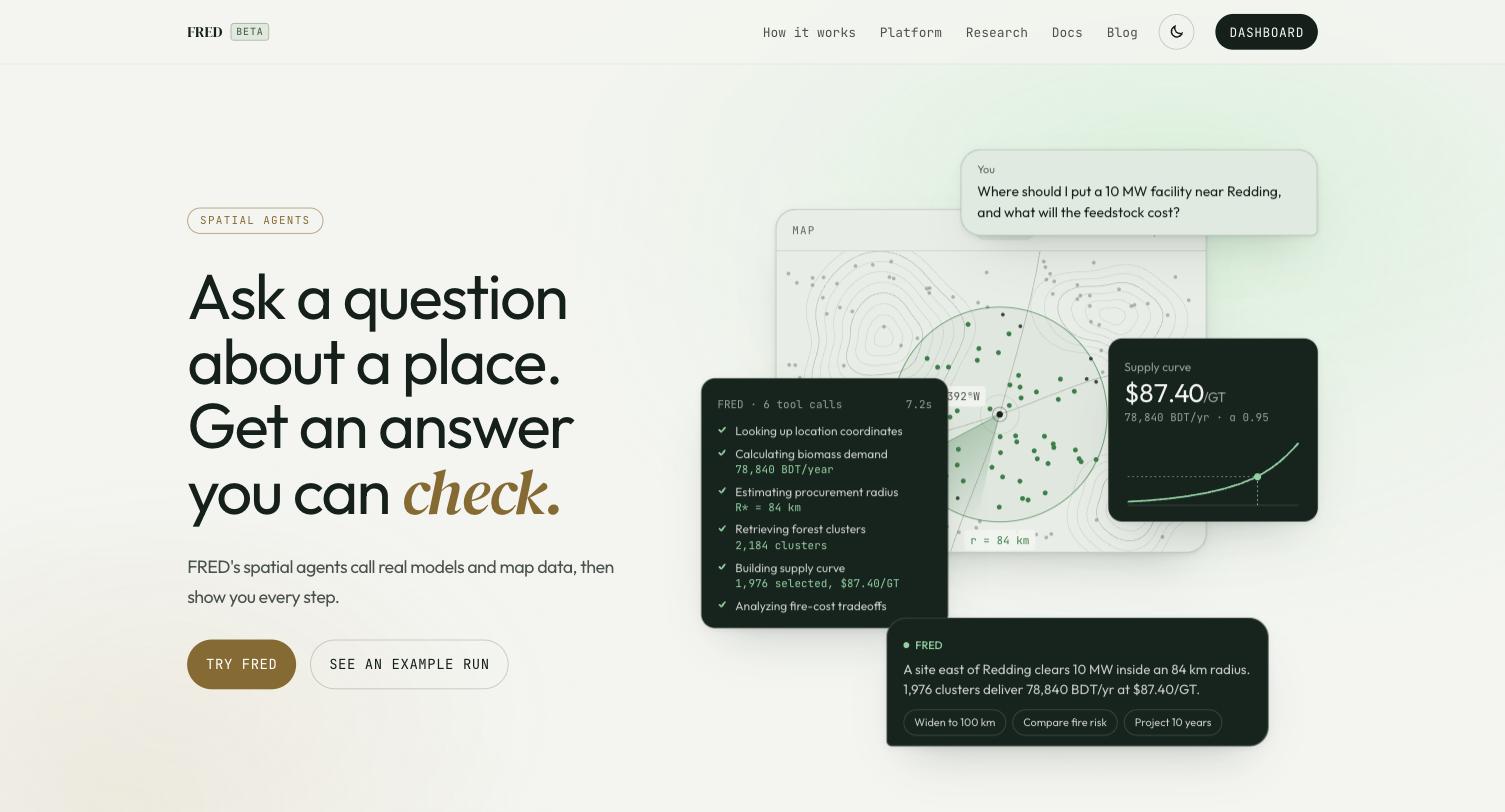
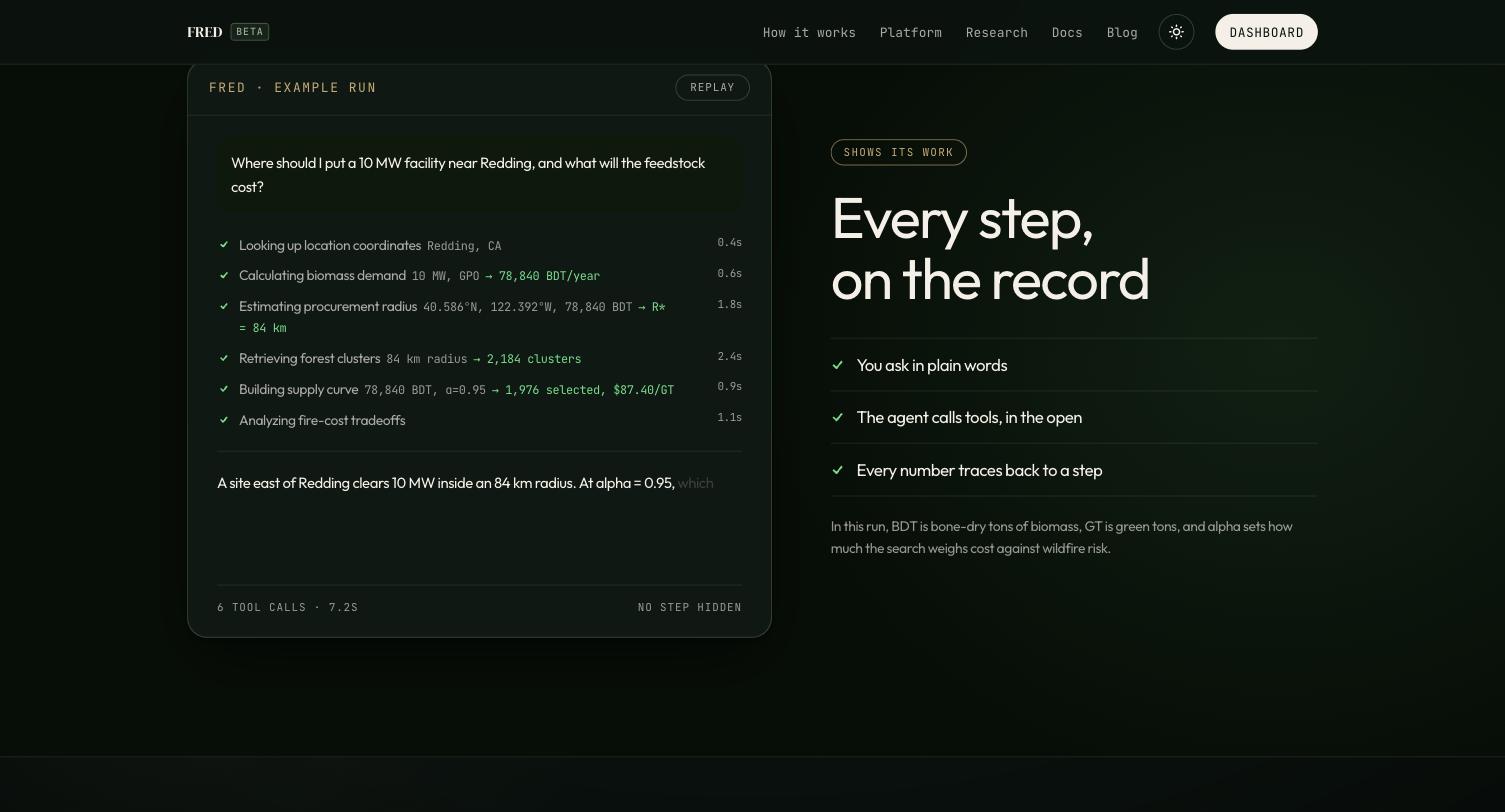
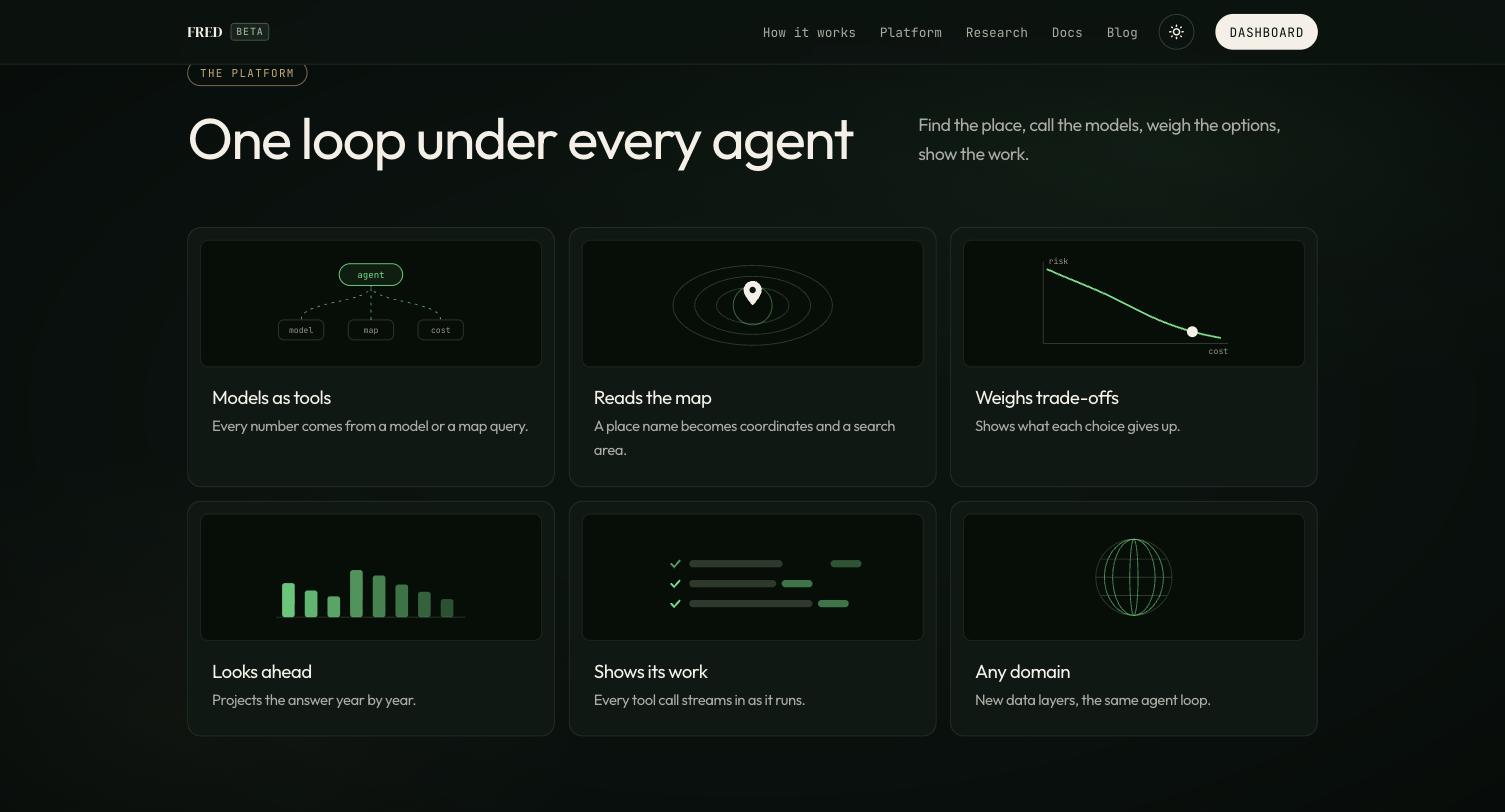
A landing page that shows the product working
No stock art. Every section replays a real run, so a visitor sees what the agent does before they sign in.
02 · Product
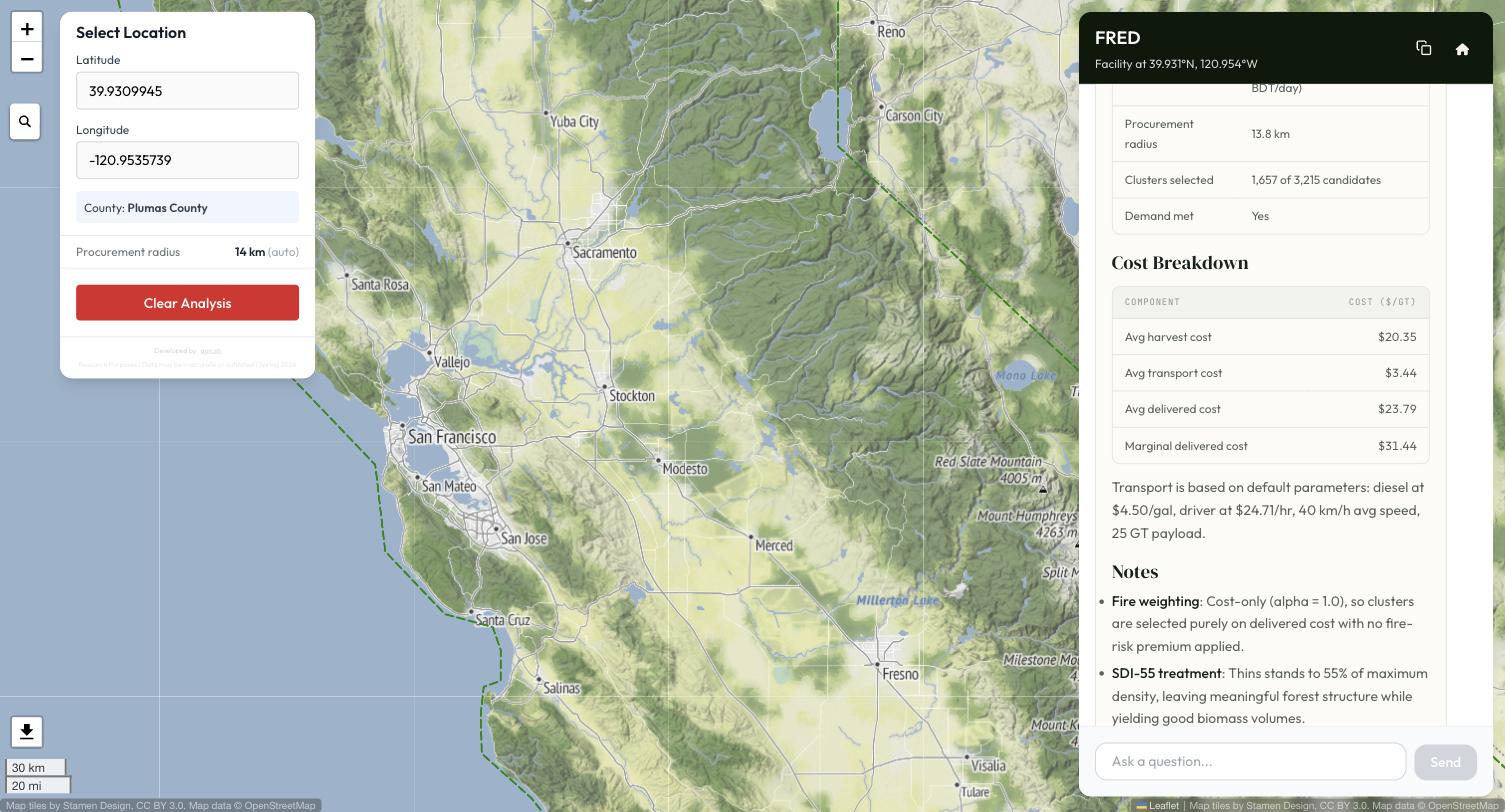
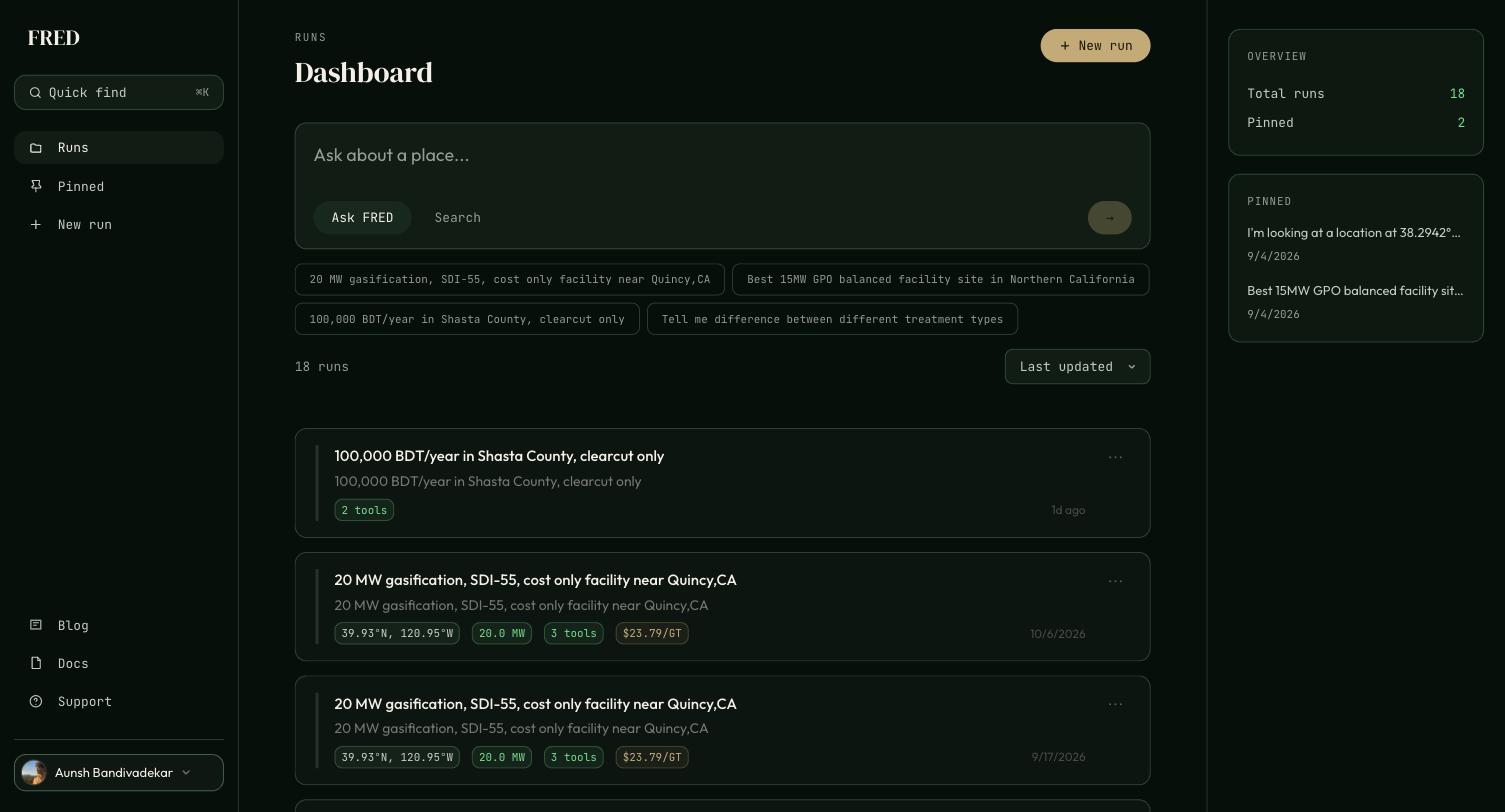
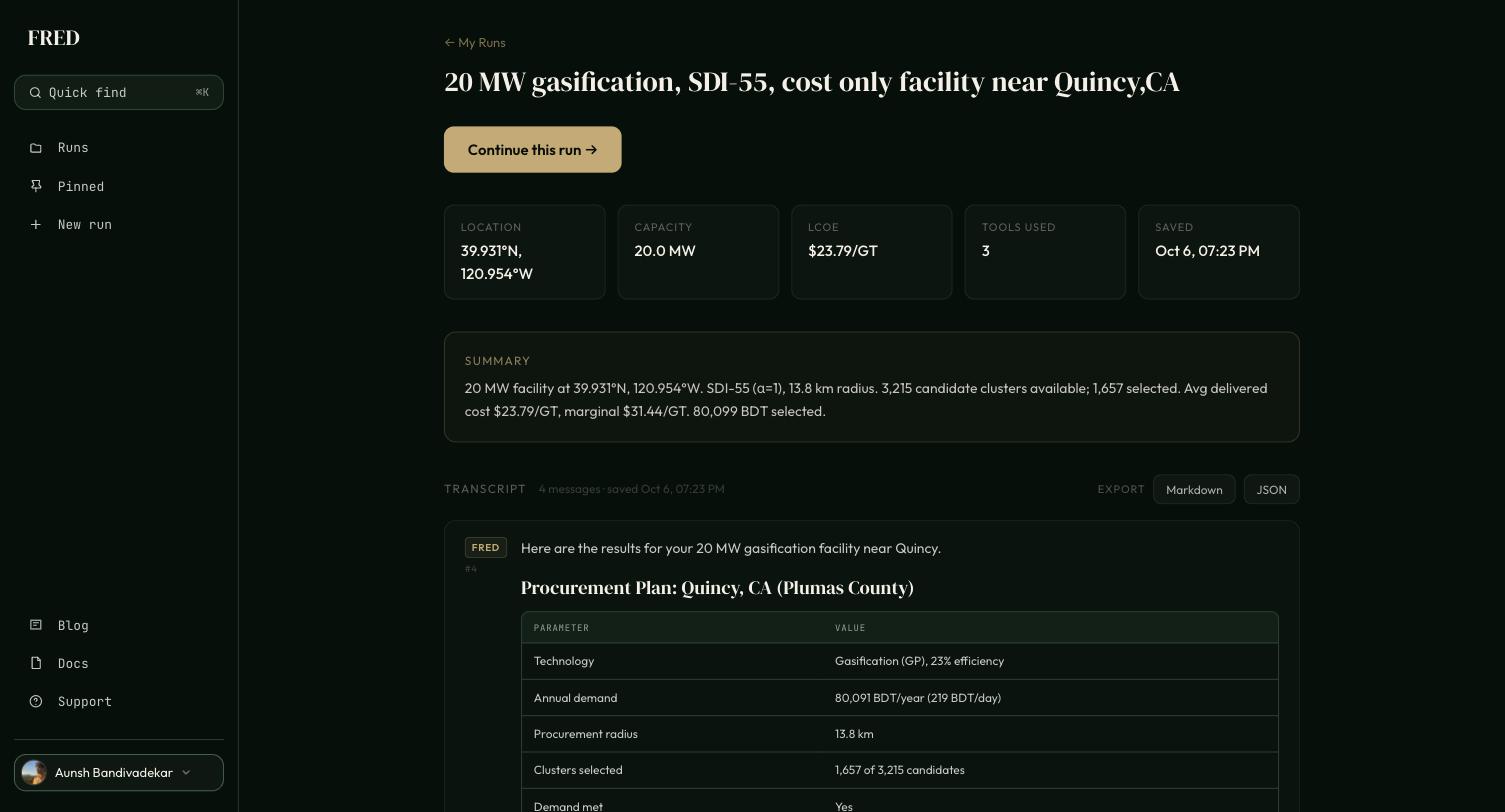
From a question to a report you can export
03 · Mobile
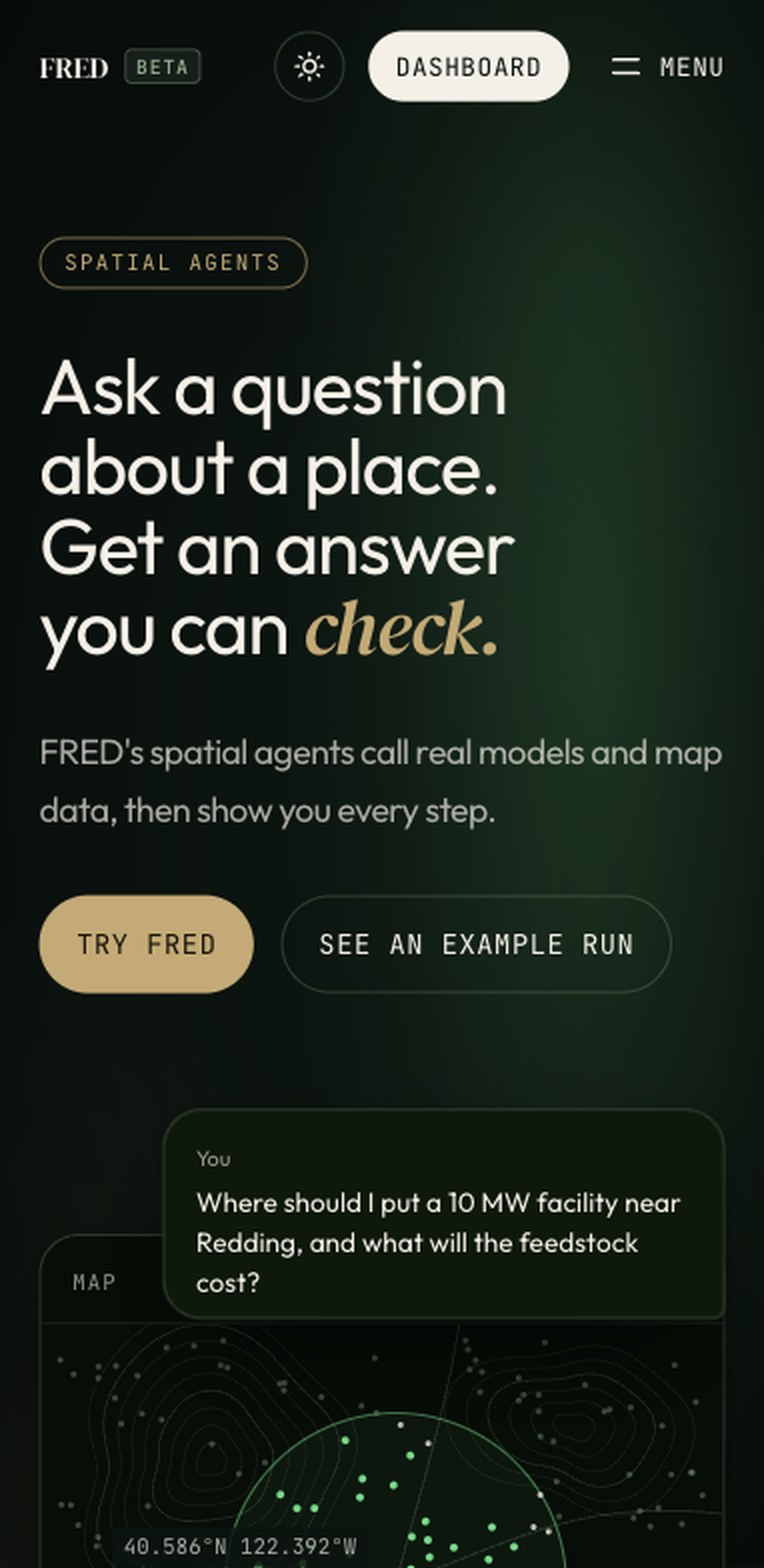
The same product at 390 pixels
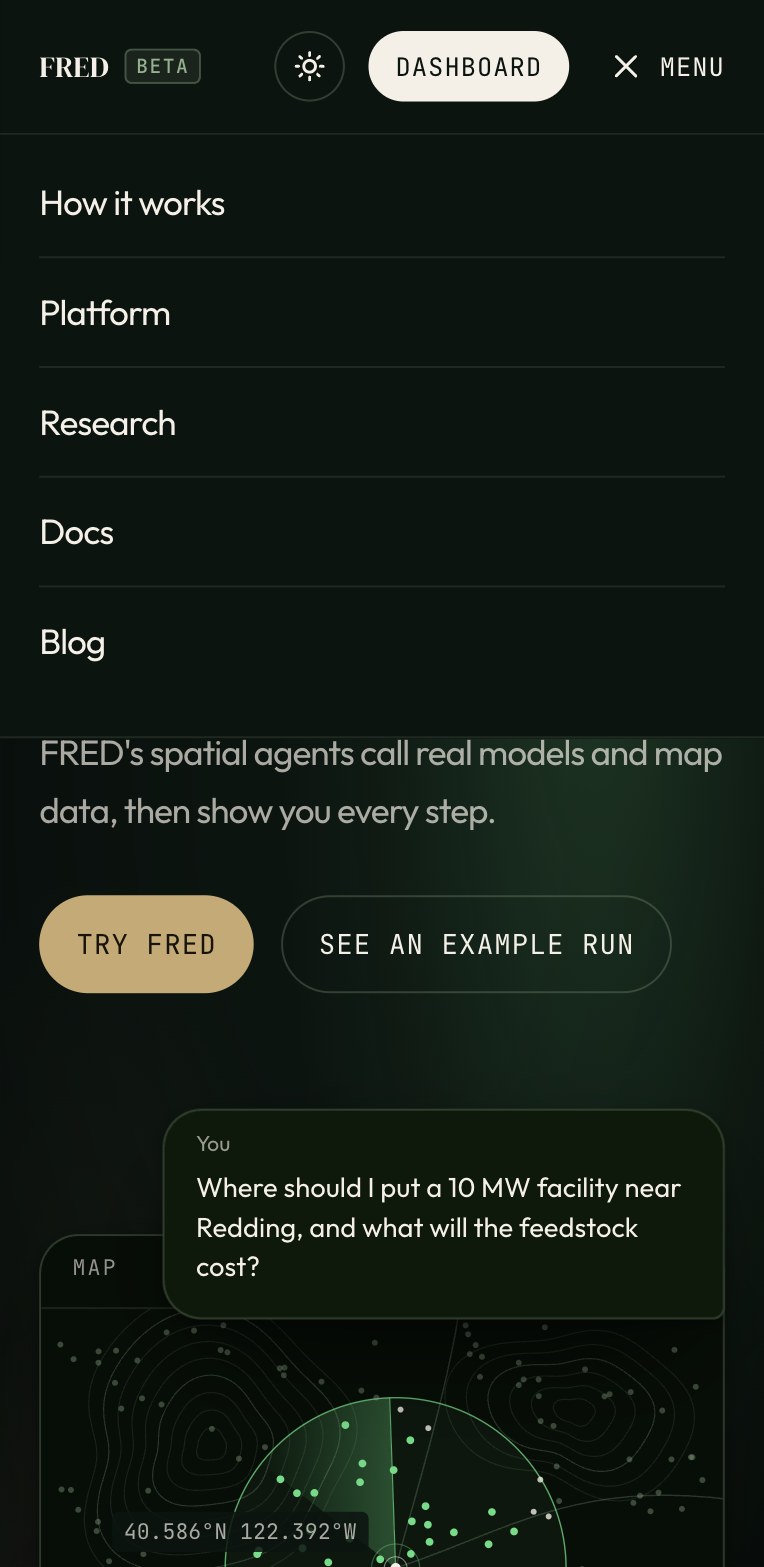
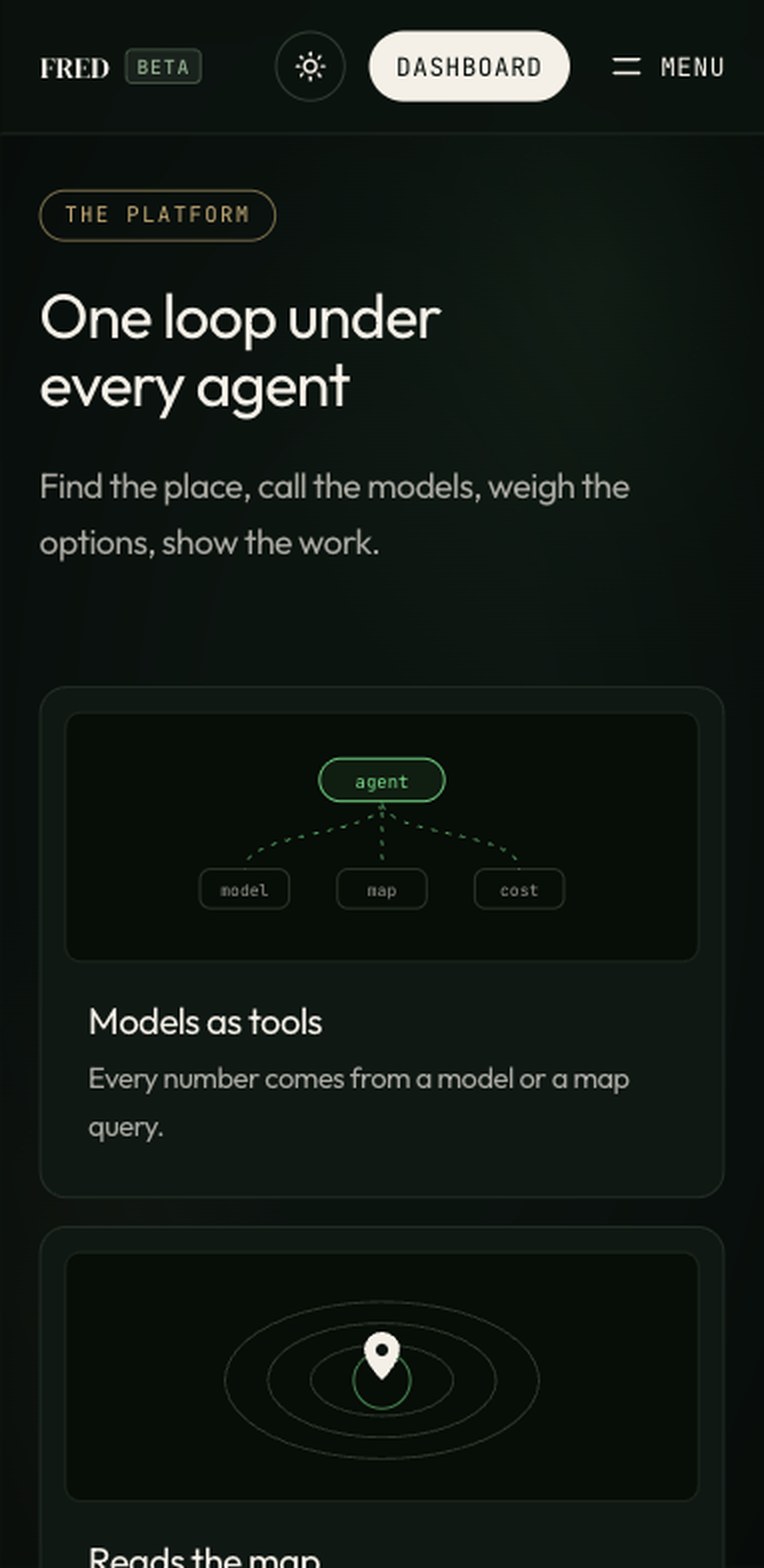
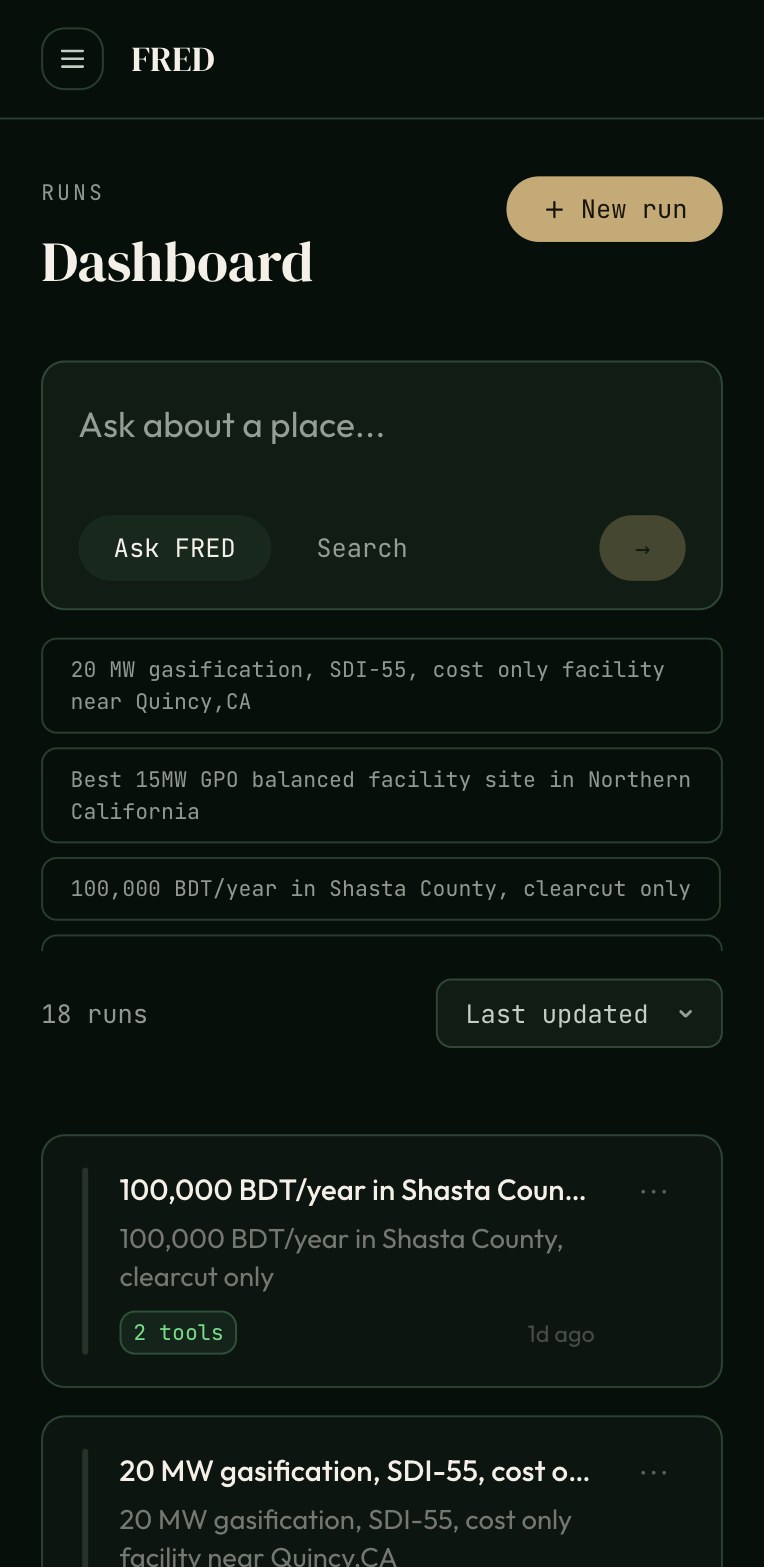
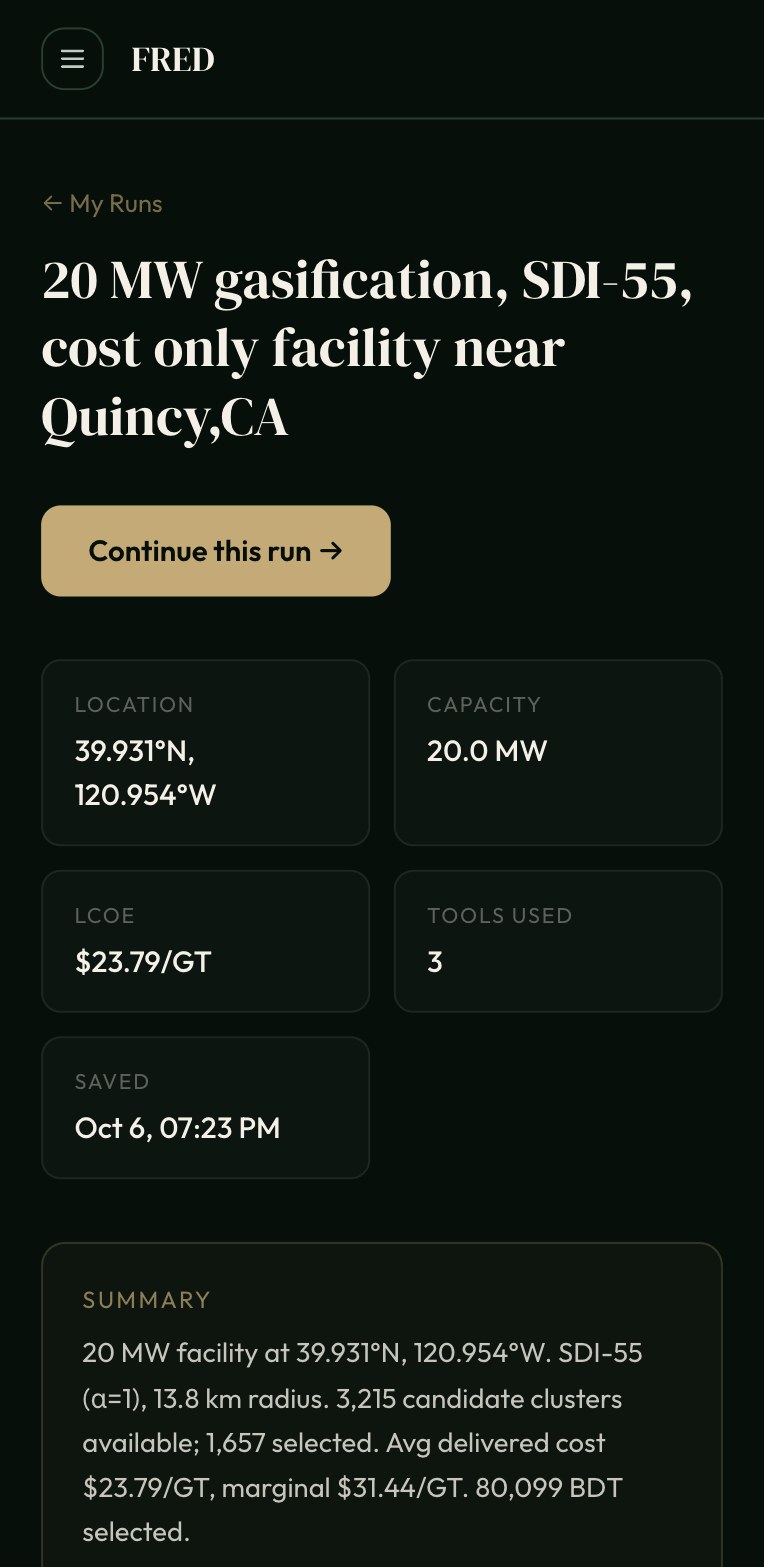
The hero trims down to the question, the map and the answer. Navigation folds into a full-width menu, the app sidebar becomes a menu button, and run summaries reflow into a two-column grid.
04 · Design system
Forest night, warm paper and one gold accent
- Canvas#0A1410
- Surface#0E1814
- Brand#395442
- Gold#C8A96E
- Signal#4ADE80
- Primary#F5F0E6
- Ink#16211B
Outfit
Ask a question about a place.
Interface and headlines
DM Serif Display
check.
Wordmark and one italic word per headline
JetBrains Mono
R* = 84 km · 1.8s
Coordinates, timings, units and button labels
Tokens as color channels
/* :root and :root[data-landing-theme="light"] */
--c-canvas: 10 20 16;
--c-gold:   200 169 110;
--c-accent: 74 222 128;

/* Tailwind reads them by name */
<header class="sticky bg-canvas/85 backdrop-blur-md border-b border-edge-soft">- Storing colors as bare RGB channels lets Tailwind add opacity, so bg-canvas/85 works with no extra tokens.
- Components use names like canvas, edge and gold, never hex values. The light theme only redefines the variables.
- A skip link and a focus ring token ship with the base layout.
05 · Tech
How the frontend is put together
1 · Browser
React single-page app
TypeScript, Tailwind on shared tokens, Leaflet for the map. Routes load their own code.
2 · Stream
Server-sent events
Tool steps and answer text stream to the browser as they happen.
3 · Agent
FastAPI and Redis
Runs the agent loop on Google Cloud and caches result sets between turns.
4 · Data
PostGIS and models
Spatial queries, H3 hexagon grids and machine learning surrogates of cost and fire models.
Code split by route
The landing page ships one script. The map and chat, about 134 KB more, load only when someone opens the app.
Streaming states
Steps appear as they finish, each with its inputs, output and time, so a multi-second run never looks frozen.
Runs you can resume
Every run is saved as a transcript that reopens in the workspace and exports to Markdown or JSON.
- React
- TypeScript
- Tailwind CSS
- Leaflet
- Server-sent events
- Sanity
- FastAPI
- Redis
- PostGIS
- H3
- Google Cloud
06 · Performance
Measured, not guessed
First load of biofred.us in desktop Chrome on October 30, 2026, read from the browser's Performance API.
Landing page
biofred.us · HTTP/2- JavaScript, compressed (352 KB uncompressed)
107KB
- CSS, one file
13KB
- requests on first load
13
- cumulative layout shift
0
- until the load event
1.1s
- map and chat code, loaded only in the app
+134KB
07 · Optimization
Fast enough that a what-if feels instant
A run log only feels honest if it moves. Each fix below is written up on the FRED blog.
< 2 ms
Hexagon drill-down
Records are pre-grouped at three hexagon sizes, so a region-wide question becomes three fast lookups.
Read the write-up(opens in a new tab)1 to 3 s
Radius before retrieval
A geometric binary search sizes the search area first, against 8 to 25 seconds for running the full pipeline to find out.
Read the write-up(opens in a new tab)½
Half the wait on follow-ups
Splitting database reads from math over cached results halved latency when a user changes one input.
Read the write-up(opens in a new tab)5200×
Surrogate cost model
Machine learning surrogates return cost estimates 5200 times faster than the Fuel Reduction Cost Simulator.
Read the write-up(opens in a new tab)
08 · Applied AI
Retrieve numbers, compute, then write
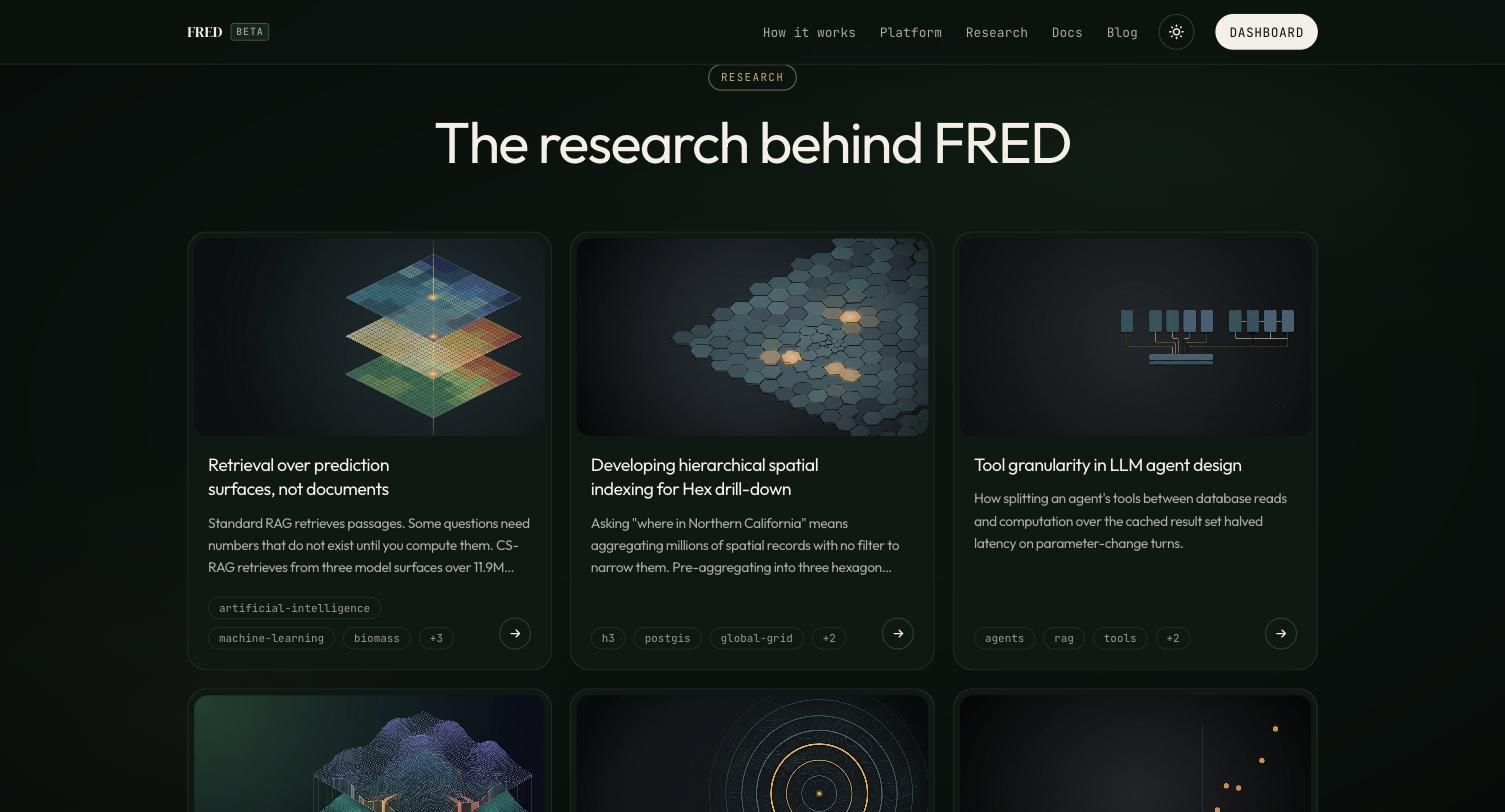
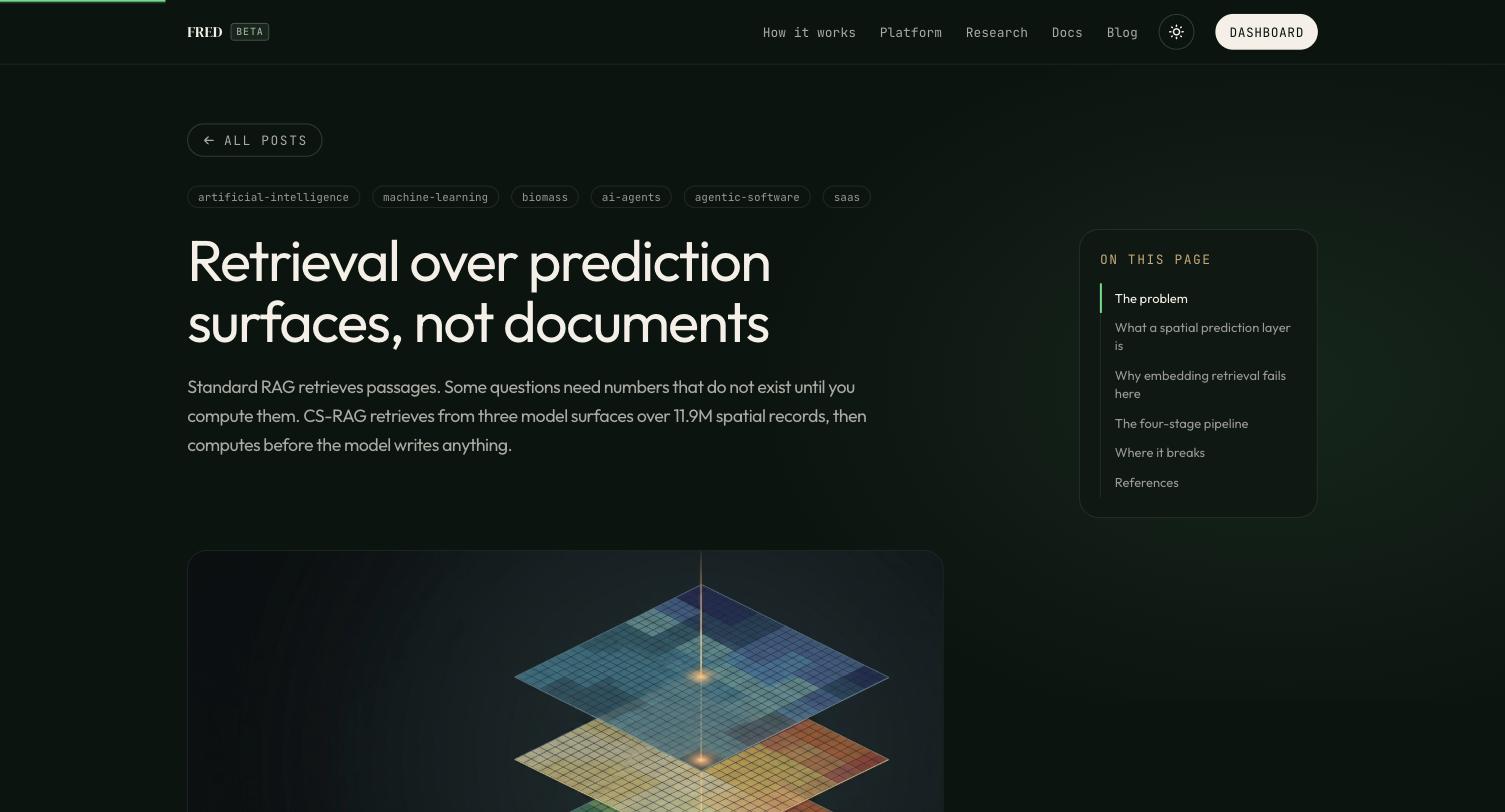
Standard retrieval-augmented generation pulls passages of text. Siting questions need numbers that don't exist until something computes them.
FRED's Compositional Spatial retrieval pulls from three model prediction surfaces over 11.9 million spatial records, computes the answer, and only then lets the language model write.
That order is what makes the interface possible. Every number in an answer comes from a tool call, so the screen can show where it came from.
166M
model predictions statewide
3.1M
forest sites indexed
09 · Next
What I'd ship next
- 01Run Lighthouse in CI with a budget that keeps the landing script near 107 KB.
- 02Rework the map workspace for phones, where the agent panel and map controls compete for the same space.
- 03Show each tool's latency and cache hits live in the run log.
- 04Open a public API once the first endpoints settle.