Case study · Frontend
reaktr.cc
Cost analytics for cultivated food, with an AI copilot built in.
- Role
- Designed and built all of it. Led a team of three researchers
- Where
- McDonald-Nandi Lab, UC Davis
- Frontend
- Next.js, React, Tailwind CSS, Chart.js
- Year
- 2025. Live at reaktr.cc
Summary
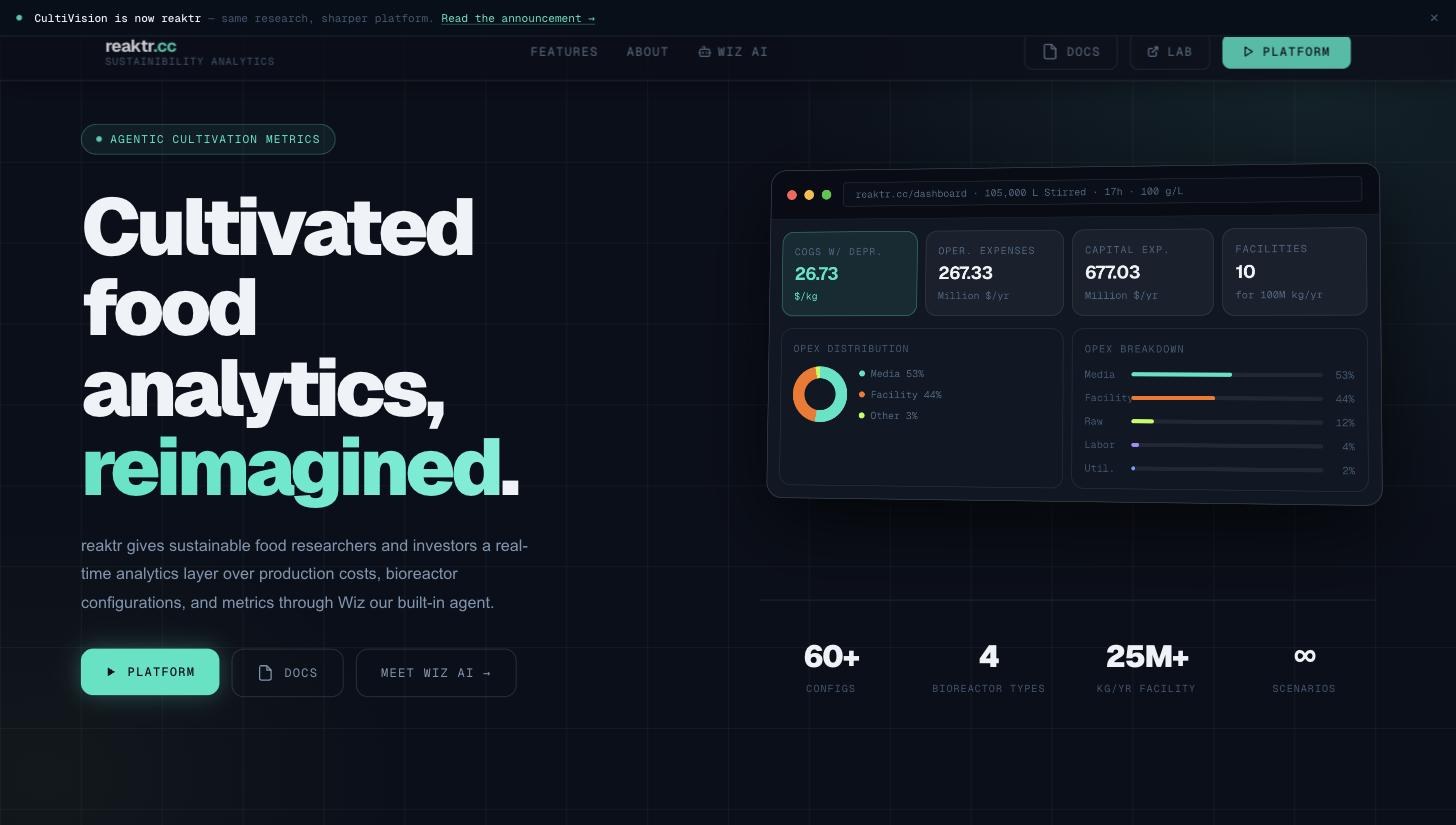
The cost of cultivated meat swings on a few dozen inputs: reactor size, doubling time, media price, labor. reaktr turns the lab's cost model into a dashboard anyone can tune, share by link and question in plain English.
4
bioreactor types to compare
60+
preset configurations
7
cost categories, each with its own chart
$26.73
per kg for the 105,000 L baseline
My part
What I built
Every screen and service on this page is my work. I also ran the project for a team of three researchers in Jira.
- Product and brand
- The CultiVision product and its rebrand to reaktr.
- Landing page
- The redesign, with live analytics previews and the Wiz demo.
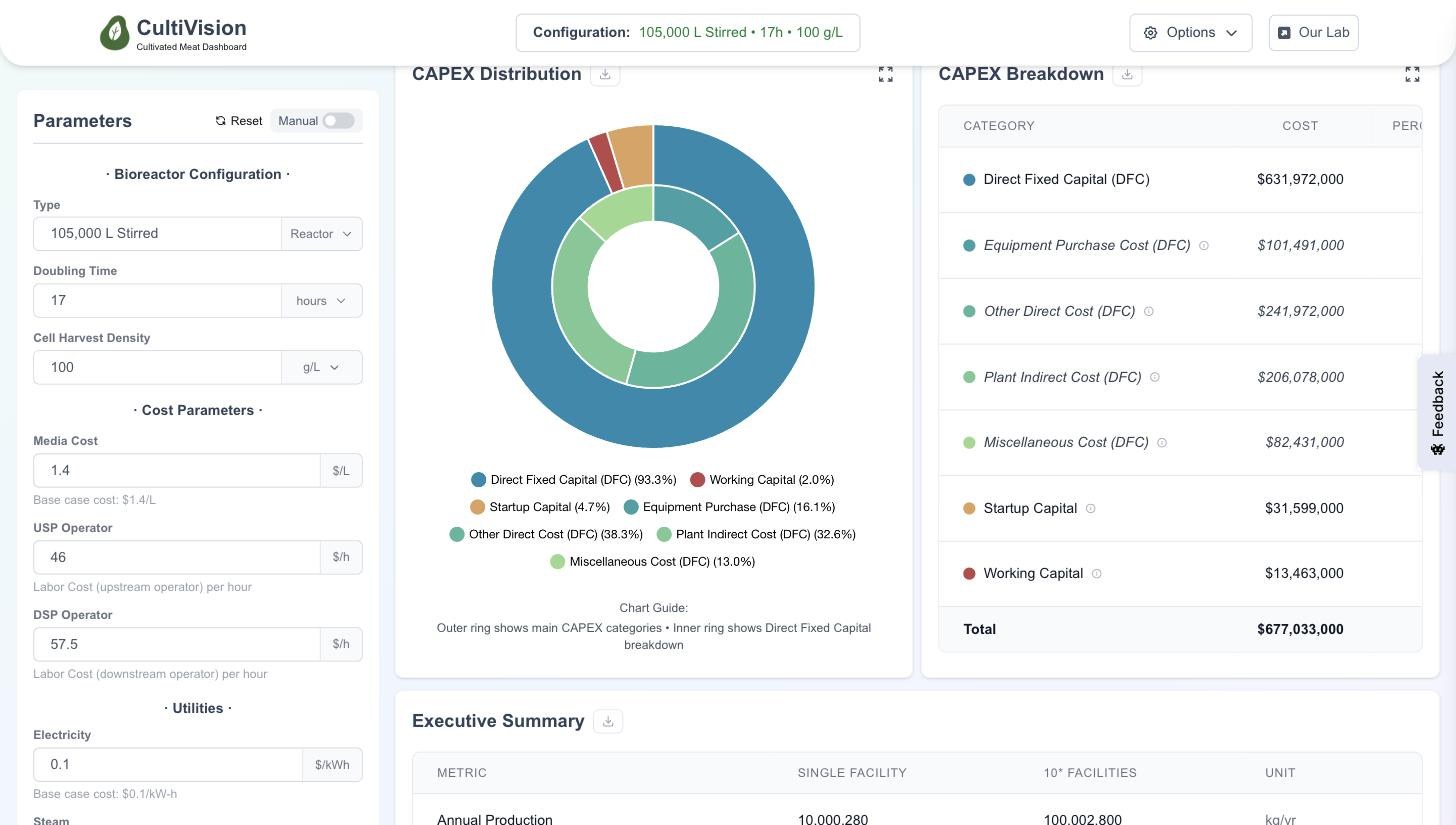
- Dashboard
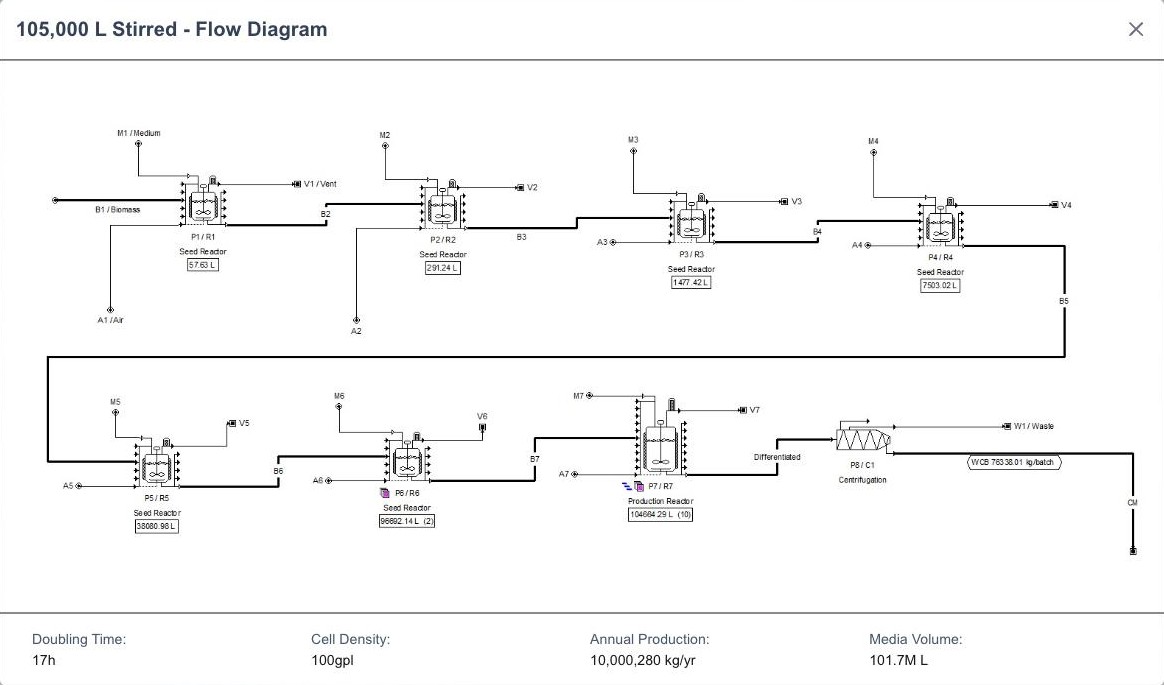
- Parameters panel, result cards, OPEX and CAPEX charts including the nested doughnut, and the process flow diagrams.
- Sharing and export
- Share links that carry the whole configuration, chart and table downloads, CSV export and the full report.
- Access control
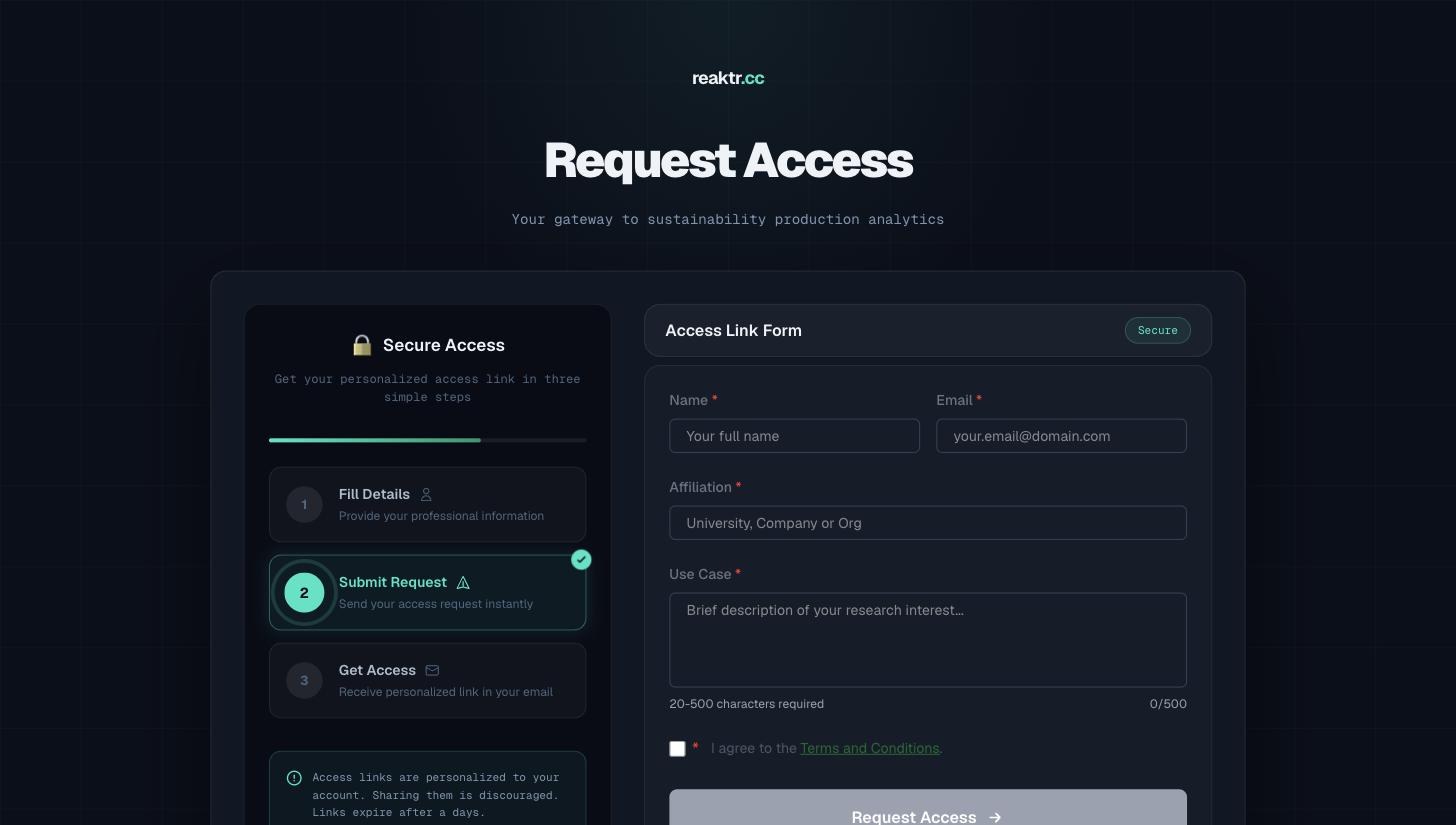
- The request form, email verification and expiring personal links.
- Wiz
- The retrieval-augmented assistant, its streaming API and the chat interface.
01 · Landing page
Show the numbers, not stock art
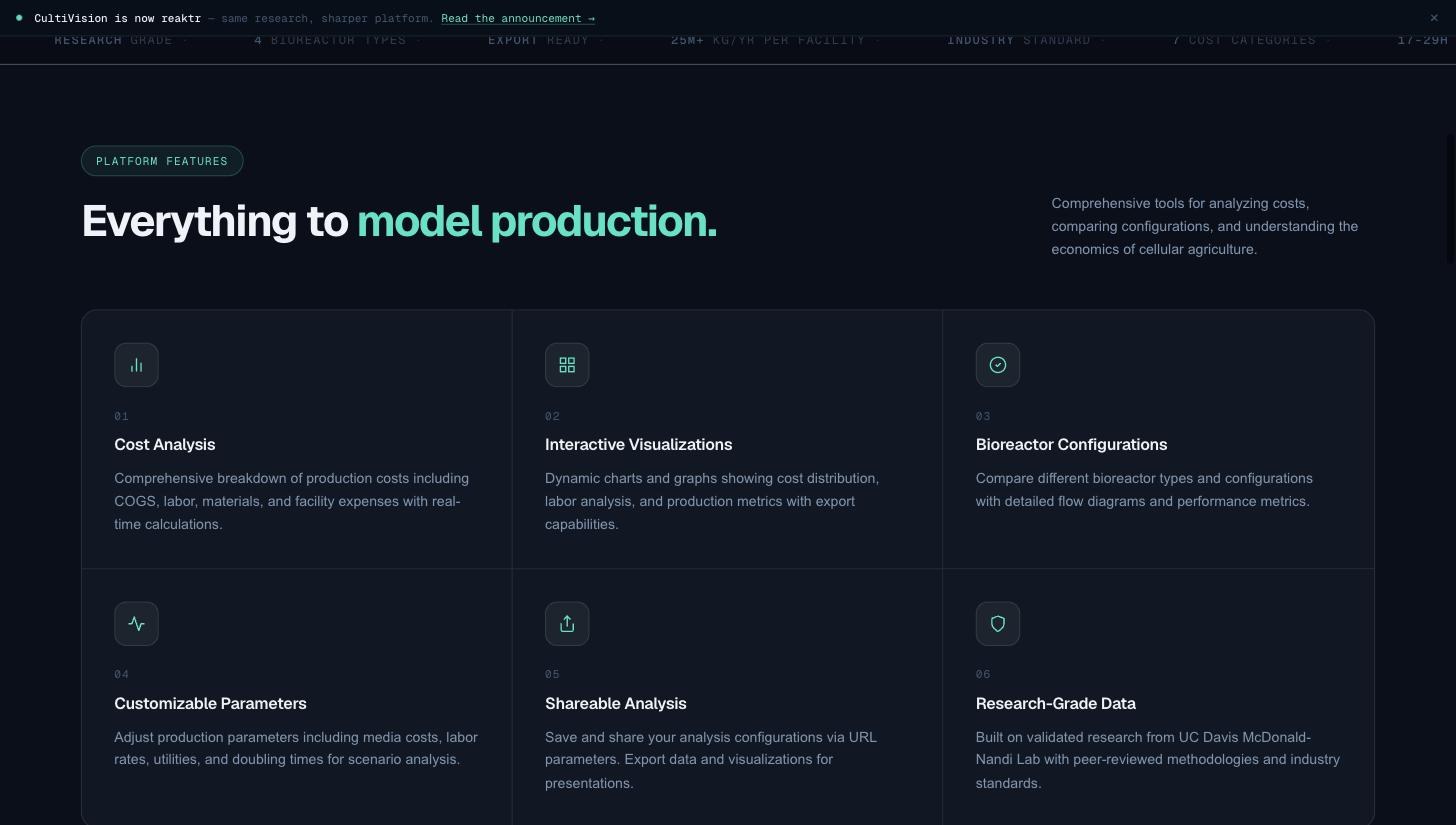
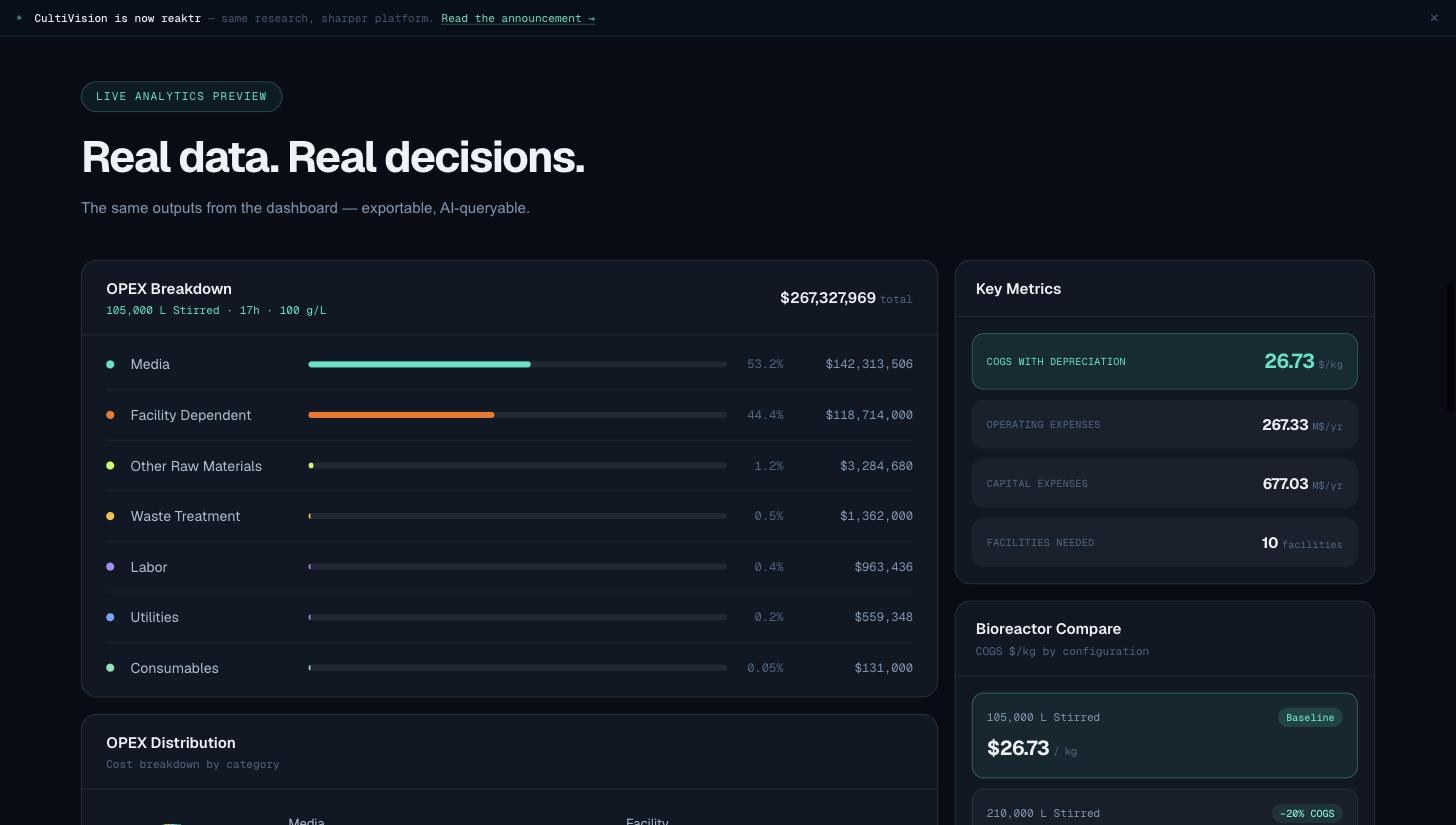
Every section of the redesigned landing page is built from the dashboard's real output, so a visitor sees the product before asking for access.
02 · Product
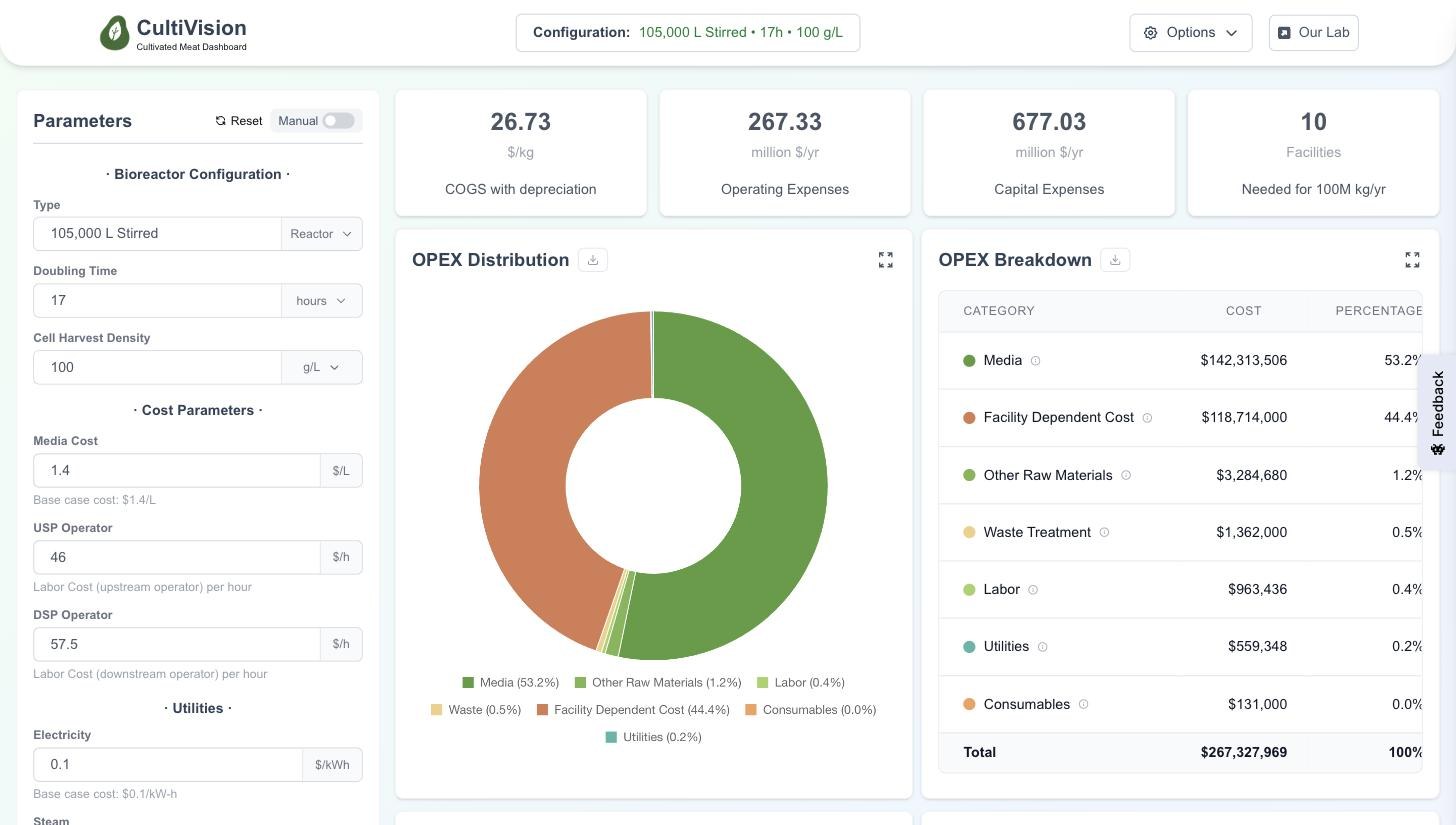
Change an input, see the cost move
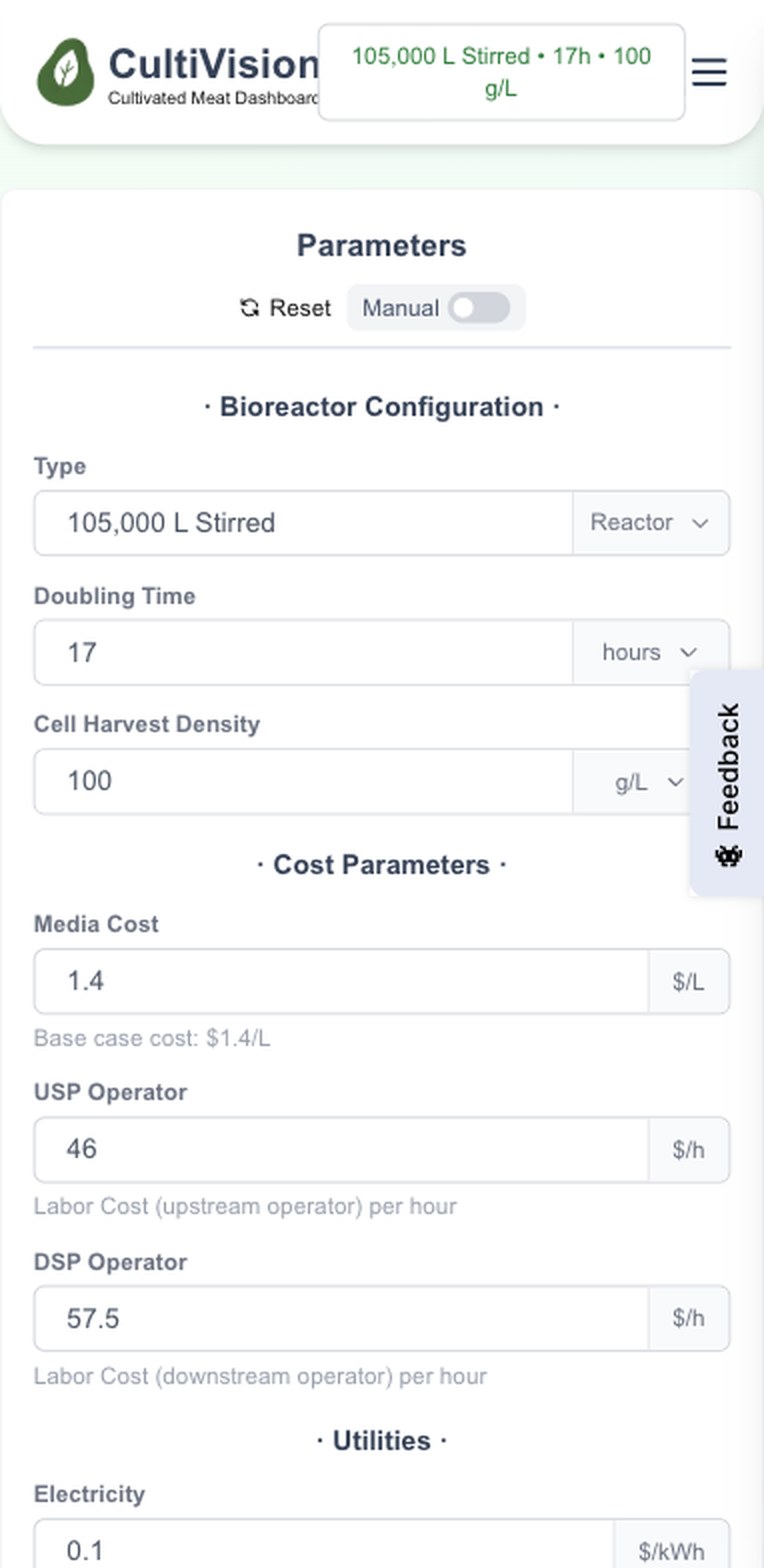
Parameters on the left, results on the right. Reactor, doubling time and cell density come as presets, and every cost input shows its base case underneath.
03 · Product
Open to request, gated by link
Access is by request. Visitors fill in a short form, then get a personal link by email that expires after a few days. A three-step tracker shows where they are.
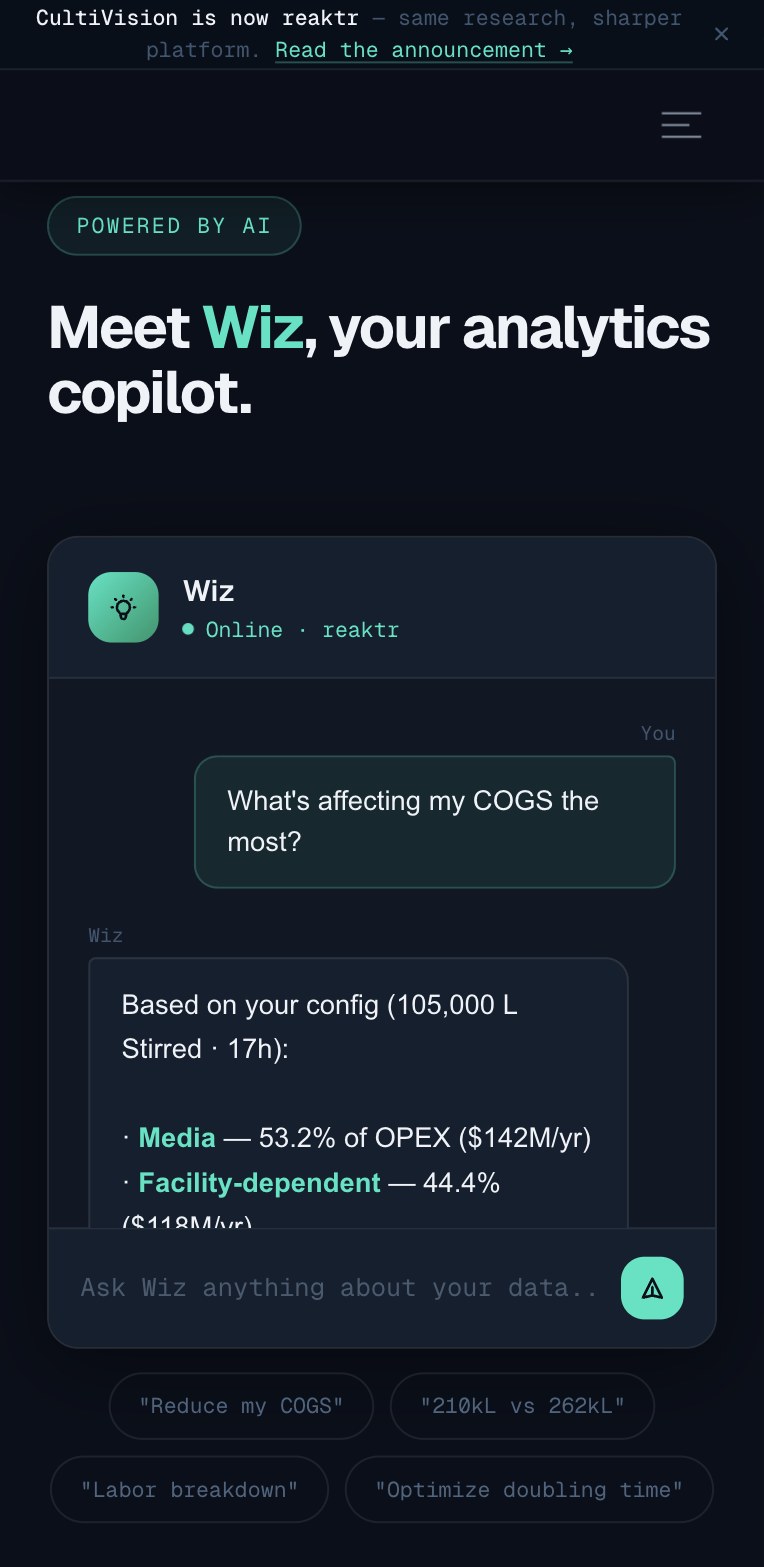
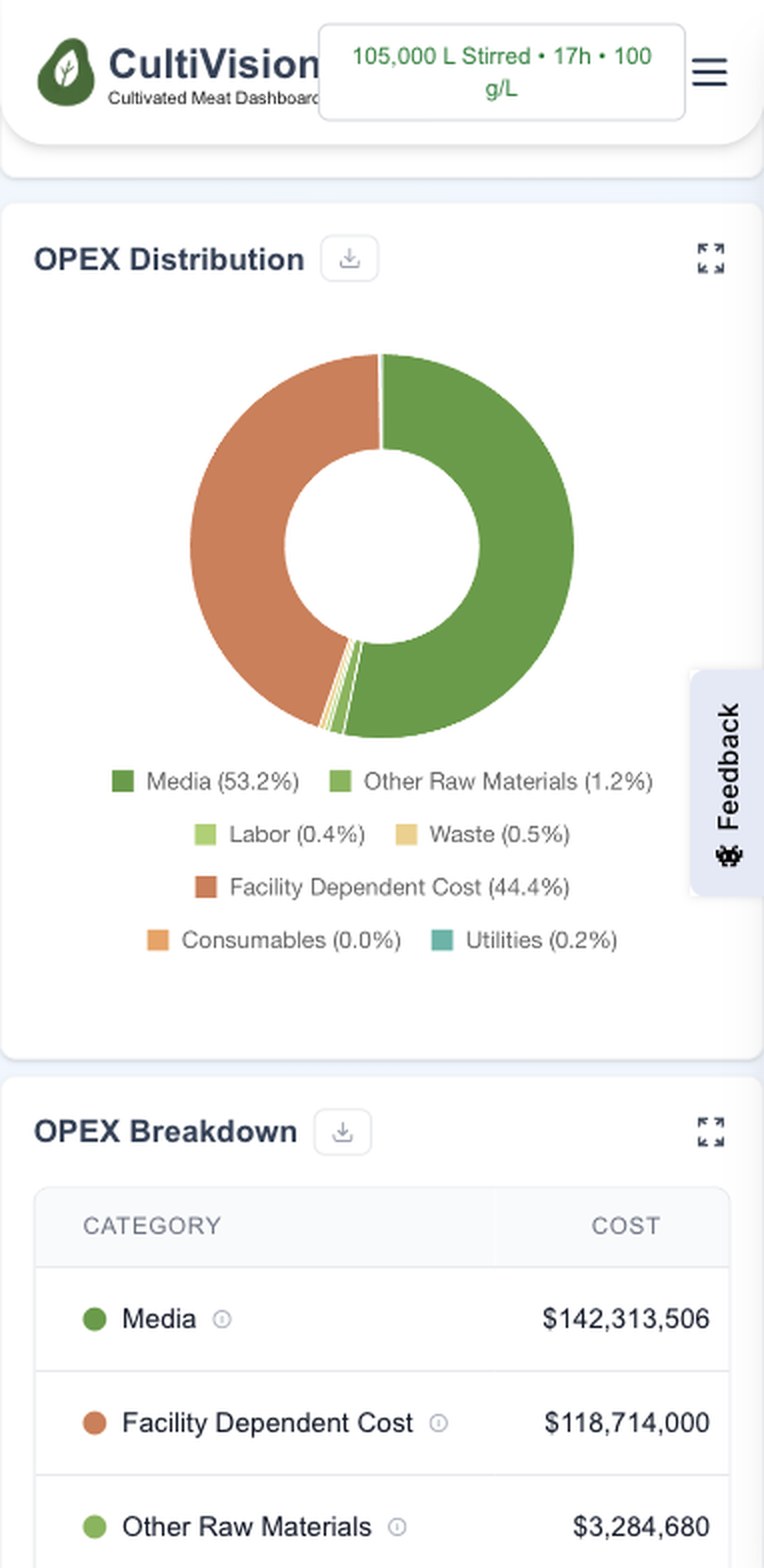
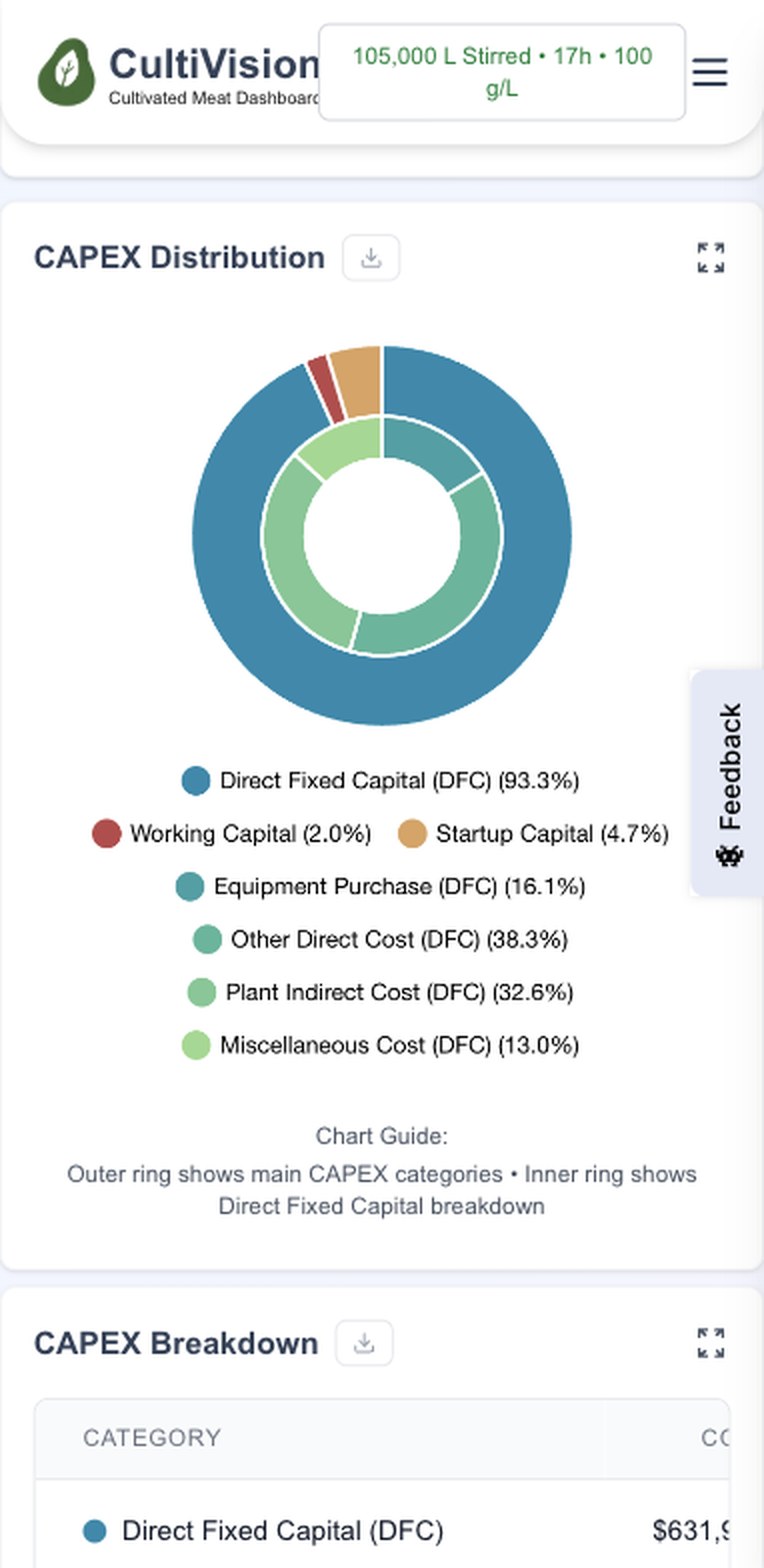
04 · Mobile
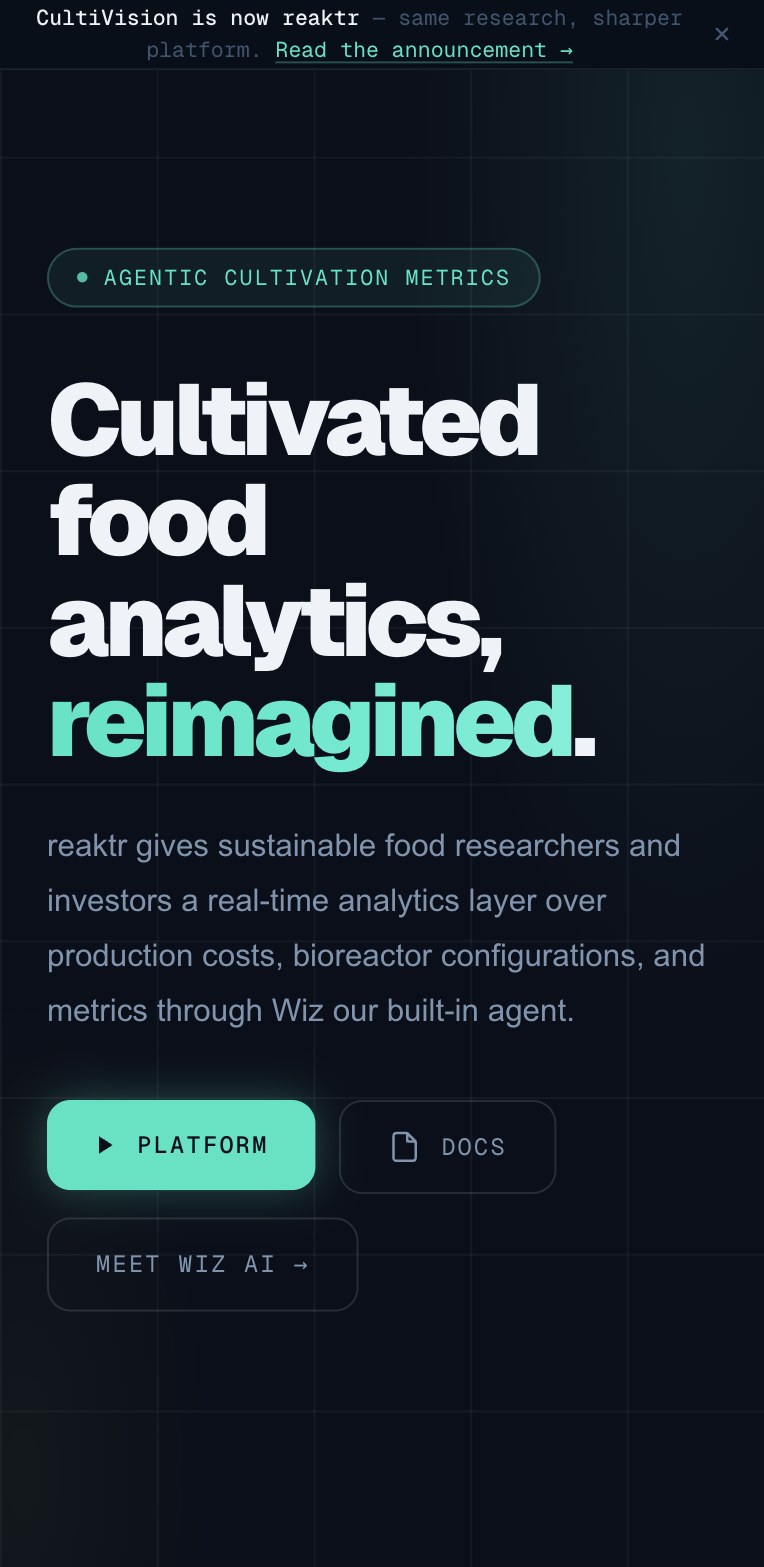
The same tools at 390 pixels
The landing page stacks into one column and the copilot keeps its prompt chips. In the dashboard, parameters and charts stack, and each chart keeps its legend and download button.
05 · Design system
Night navy and one mint signal
- Ground#0A0F1A
- Surface#0F1824
- Raised#141F2E
- Slate#7A95B0
- Text#EEF2F7
- Mint#00E5C3
Geist 900
Real data. Real decisions.
Black-weight headlines with tight tracking
Geist Mono
COGS W/ DEPR. · 105,000 L
Uppercase labels, pills and units
- One phrase per headline goes mint. Everything else stays in the navy and slate range.
- Both fonts load through next/font, so there's no layout jump when they arrive.
- The dashboard still runs the earlier CultiVision look. Moving it onto this system is next.
06 · Tech
Two apps, one front door
1 · reaktr.cc
Marketing site
Next.js App Router with server components, built with Turbopack and served from Netlify.
2 · /access
Request and verify
A validated form, then a personal, expiring link sent by email.
3 · Dashboard
Static Next.js export
Hosted on GitHub Pages. Chart.js on canvas, Tailwind CSS v4 and the whole configuration kept in the URL.
4 · Wiz
Streaming assistant
Retrieval-augmented answers streamed back over its own API.
Share by URL
Only the inputs that differ from the defaults go into the link, so a shared URL stays short and opens the exact same analysis.
Export everything
Every chart and table has its own download, plus a full report, so the numbers can go straight into a slide or a paper.
Explain every term
Each cost line has an info tooltip, and each input shows its base case, for readers who aren't bioprocess engineers.
- Next.js
- React
- TypeScript
- Tailwind CSS
- Chart.js
- Turbopack
- next/font
- Netlify
- GitHub Pages
07 · Code
Share links that only carry what changed
A shared link has to reopen the exact analysis without a database. The encoder keeps only the inputs that differ from the defaults and packs them into URL-safe base64.
Lightly trimmed. The decoder reverses it and merges onto the defaults, so old links survive new inputs.
export function encodeProductionCosts(costs: ProductionCosts): string {
  const changedParams: Record<string, number> = {};

  orderedKeys.forEach((key) => {
    const defaultValue = DEFAULT_PRODUCTION_COSTS[key];
    const currentValue = costs[key];

    if (Math.abs(currentValue - defaultValue) > 0.001) {
      changedParams[key] = currentValue;
    }
  });

  if (Object.keys(changedParams).length === 0) {
    return "";
  }

  return btoa(JSON.stringify(changedParams))
    .replace(/\+/g, "-")
    .replace(/\//g, "_")
    .replace(/=+$/, "");
}
08 · Performance
Measured on the live sites
Desktop Chrome, October 30, 2026, read from the browser's Performance API. Sizes are what travels over the network.
Landing page
reaktr.cc · Brotli- JavaScript in 20 chunks
363KB
- CSS
11KB
- requests
48
- layout shift
0
Dashboard
GitHub Pages · gzip- JavaScript in 18 chunks
273KB
- CSS
10KB
- requests
20
- layout shift
0
09 · Applied AI
Ask the dashboard a question
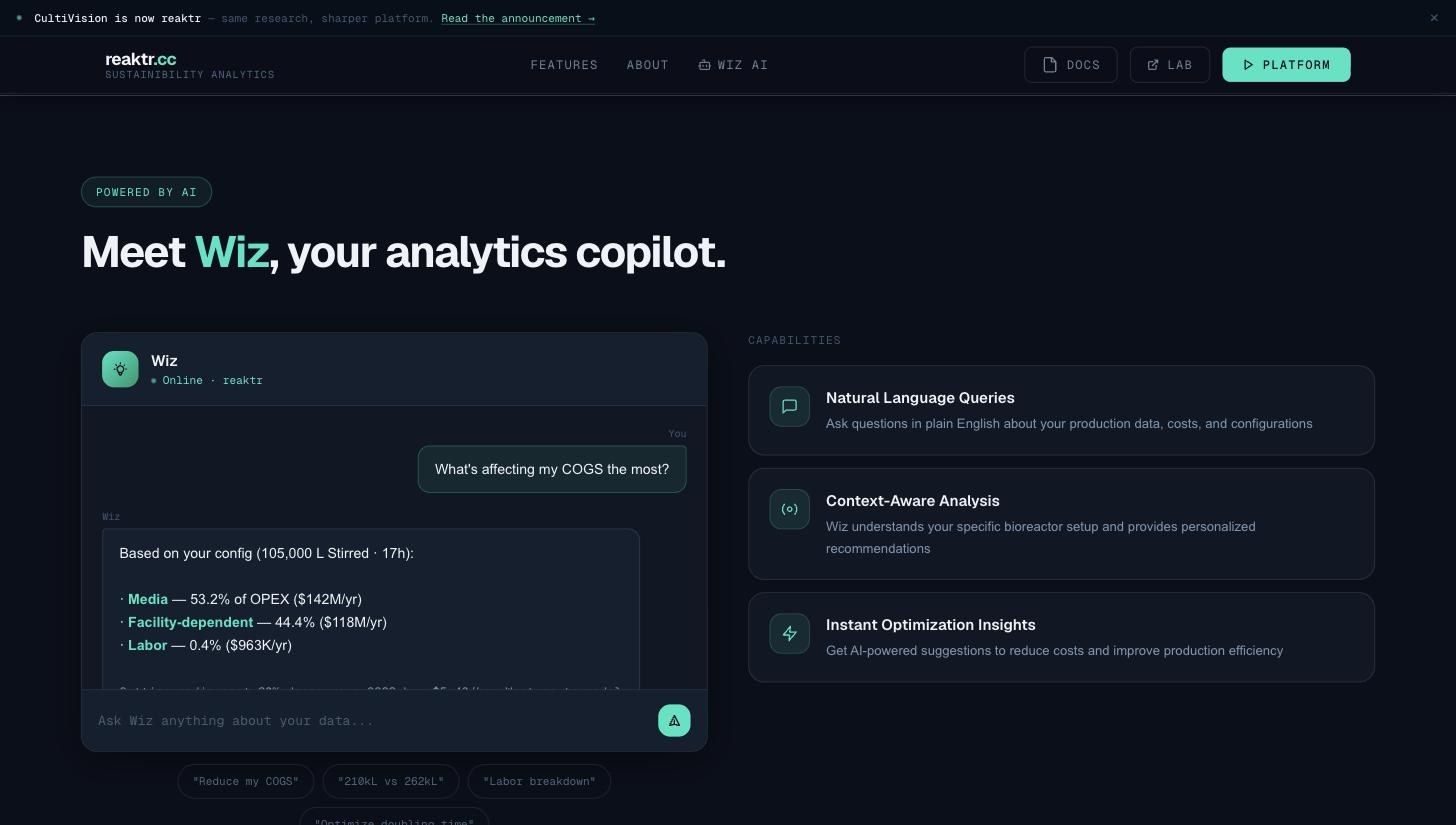
Not every visitor knows which chart answers their question. Wiz takes the question in plain English and answers from the configuration on screen.
Ask what drives cost and it ranks the categories with their share and dollar amount, then offers to model a change, like cutting media cost by 20%.
Answers are retrieval-augmented and stream in as they're written. Prompt chips under the input give first-time users a place to start.
10 · Next
What I'd ship next
- 01Move the dashboard onto the reaktr design system so the rebrand is complete end to end.
- 02Put the four headline results first on phones and fold the parameters into a drawer.
- 03Trim the landing page's 363 KB of JavaScript, starting with its three largest chunks.